
Key findings
Criminal balances
- Illicit entities hold nearly $15 billion in 2025, with stolen funds representing the largest category.
- Wallets downstream from these entities, defined as those that received funds from illicit sources in excess of 10% of total inflows, hold over $60 billion — roughly 4 times the amount held by illicit entities themselves.
- Darknet market administrators and vendors alone control over $40 billion in on-chain value.
- Bitcoin maintains dominance over other cryptocurrencies at 75% of total illicit entity balances due to its increase in value over time, but stablecoins and ether have grown substantially.
Concentration and cash-out patterns
- Balances are usually highly concentrated in only a few wallets.
- Illicit actors are rapidly evolving their laundering methodologies and cash-out infrastructure, often leveraging more cashout addresses and using them for shorter durations.
- Direct transfers from illicit entities to exchanges have collapsed from a quarterly value of roughly 40% in 2021 – 2022 to around 15% in Q2 2025.
Enforcement timing insights
- Illicit entities vary significantly in their predicted lifespan, with market-based services operating the longest
- After illicit entities have stopped receiving value on-chain, they tend to empty any remaining balances at different speeds depending on whether they hold BTC, ETH or stablecoins.
The seizable asset landscape
With the establishment of a Strategic Bitcoin Reserve (SBR) and a Digital Assets Stockpile (DAS), the United States declared that it intends to add to its pool of digital capital through additional asset seizures. And indeed, the cryptocurrency ecosystem presents law enforcement with an unprecedented opportunity: billions of dollars in illicit proceeds are sitting on public blockchains, and are theoretically seizable if authorities can coordinate action.
To date, Chainalysis has helped law enforcement agencies worldwide seize more than $12.6 billion in illicit funds through our data, software, and services. Building on this proven track record of successful seizures, we’ve conducted a comprehensive analysis of potentially seizable assets currently sitting on public blockchains.
Overall, our analysis reveals a complex landscape where illicit actors hold substantial balances. The report shows:
- The scale of the assets being held on-chain by illicit entities and downstream wallets;
- The distribution of these balances across wallets and assets, with implications for law enforcement target selection;
- The opportunities for seizures while illicit entities are still operating or before they have cashed out.
While our annual Crypto Crime Report focuses on transaction flows and the movement of illicit funds across the cryptocurrency ecosystem, this analysis takes a different approach by examining static balances — the actual cryptocurrency holdings sitting in wallets associated with illicit activity. This distinction is crucial: flow analysis helps us understand the volume and patterns of criminal activity, while balance analysis reveals the accumulated wealth that could potentially be seized by law enforcement.
There are two important observations about how illicit cryptocurrency moves across the blockchain. First, not all illicit activity involves keeping large amounts of money in one crypto wallet. Some entities, such as money laundering platforms, move money quickly from one place to another without holding onto it. Second, the total value in cryptocurrency wallets can be heavily influenced by changes in price, especially for bitcoin. Given that bitcoin’s value has grown from almost nothing to tens of thousands of dollars, the total balance in wallets has increased. This means that wallets holding stablecoins haven’t experienced a dramatic appreciation over time.
Illicit entities: A $15 billion target pool
As of July 2025, illicit entity balances of BTC, ETH, and stablecoins have reached almost $15 billion. This represents a dramatic 359% surge from the relatively modest balances observed as recently as 2020.
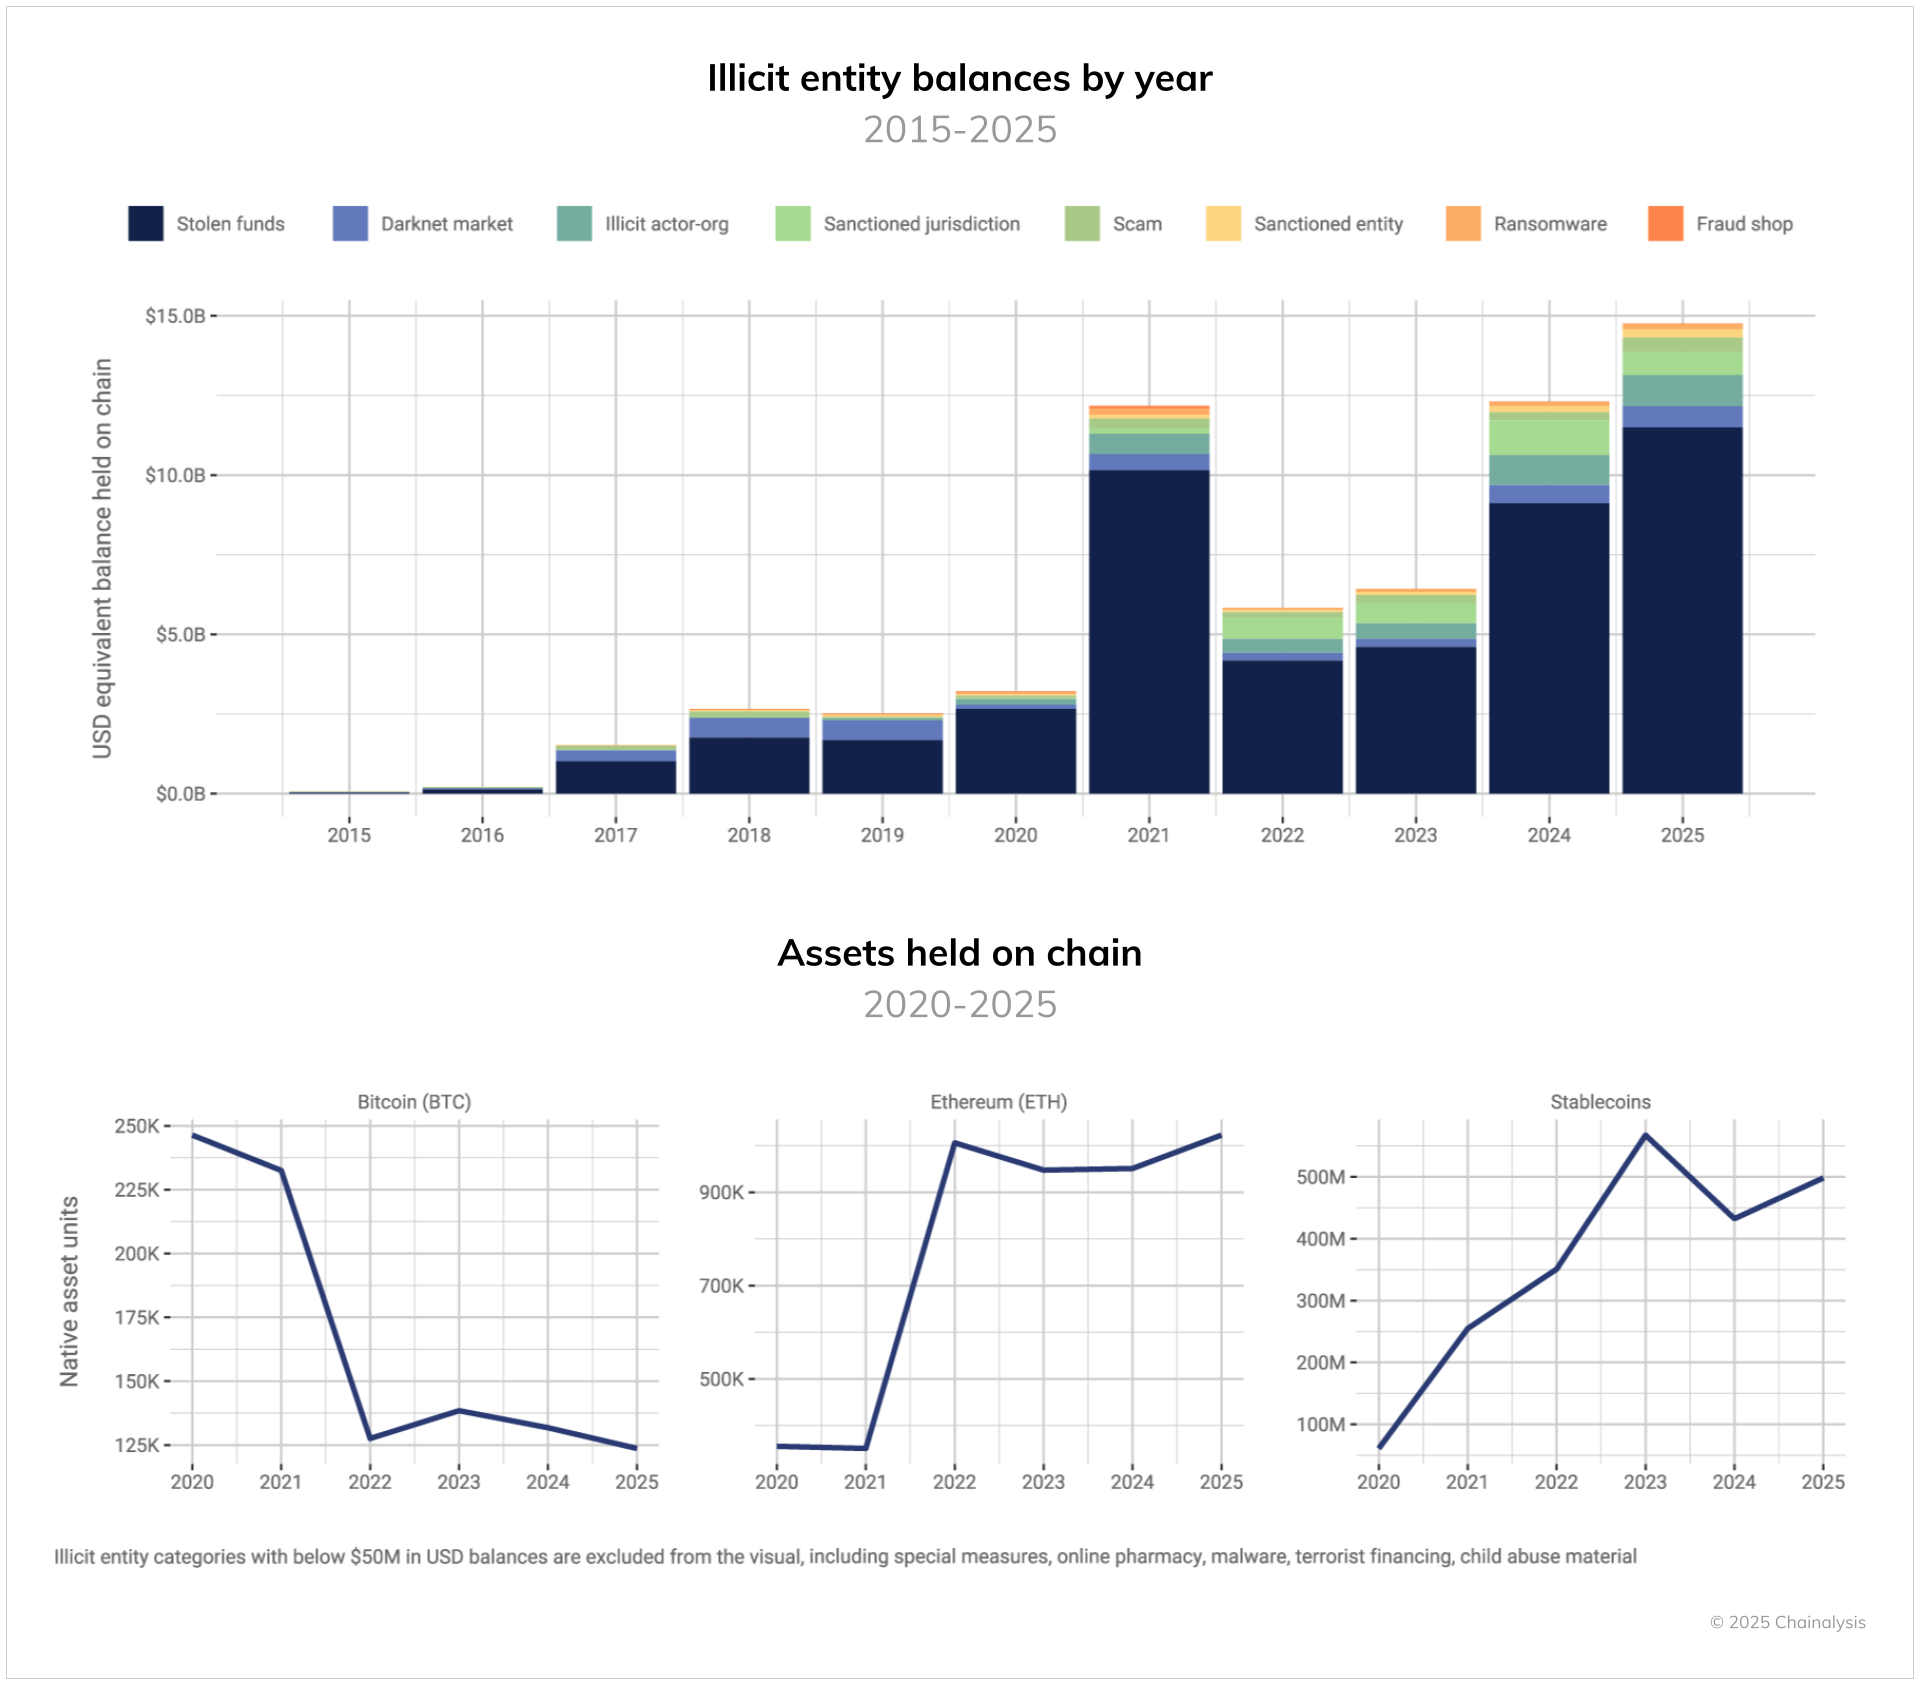
Stolen funds dominate the balance landscape, representing the single largest category of illicit entity balances. While darknet markets and scam operators typically maintain lower on-chain balances due to quickly moving funds to cash out or distribute to vendors or scam runners, stolen fund operators often hold assets while determining how to swap, launder, or liquidate the funds. It’s important to note that while scams and other illicit activities may have higher overall transaction volumes, their lower balances reflect their rapid fund movement patterns. Additionally, some sophisticated crypto thieves, as exemplified by the recent $1.5B DPRK hack of Bybit, have challenges moving these large amounts to off-ramps, given the volumes that need to be laundered, which can result in larger balances being held on-chain.
The data also reveal a clear correlation with market cycles. Balance accumulation in USD peaked previously in 2021 during the last major bull run, declined through the 2022 bear market, and surged again throughout 2024 to 2025 as prices recovered. Interestingly, not all cryptocurrencies follow the same pattern. While the amount of bitcoin held by illegal entities has decreased since 2020, ether and stablecoin holdings have been increasing. However, despite this decrease, bitcoin still represents the majority of the total value of these holdings as of the time of this writing, primarily because of its significant price increase over time.
The downstream $60 billion shadow economy
Following funds downstream, we identified a much broader network of wallets linked to these illicit activities, which hold balances of over $60 billion. This total is roughly four times the amount held directly by the illicit entity wallets themselves.
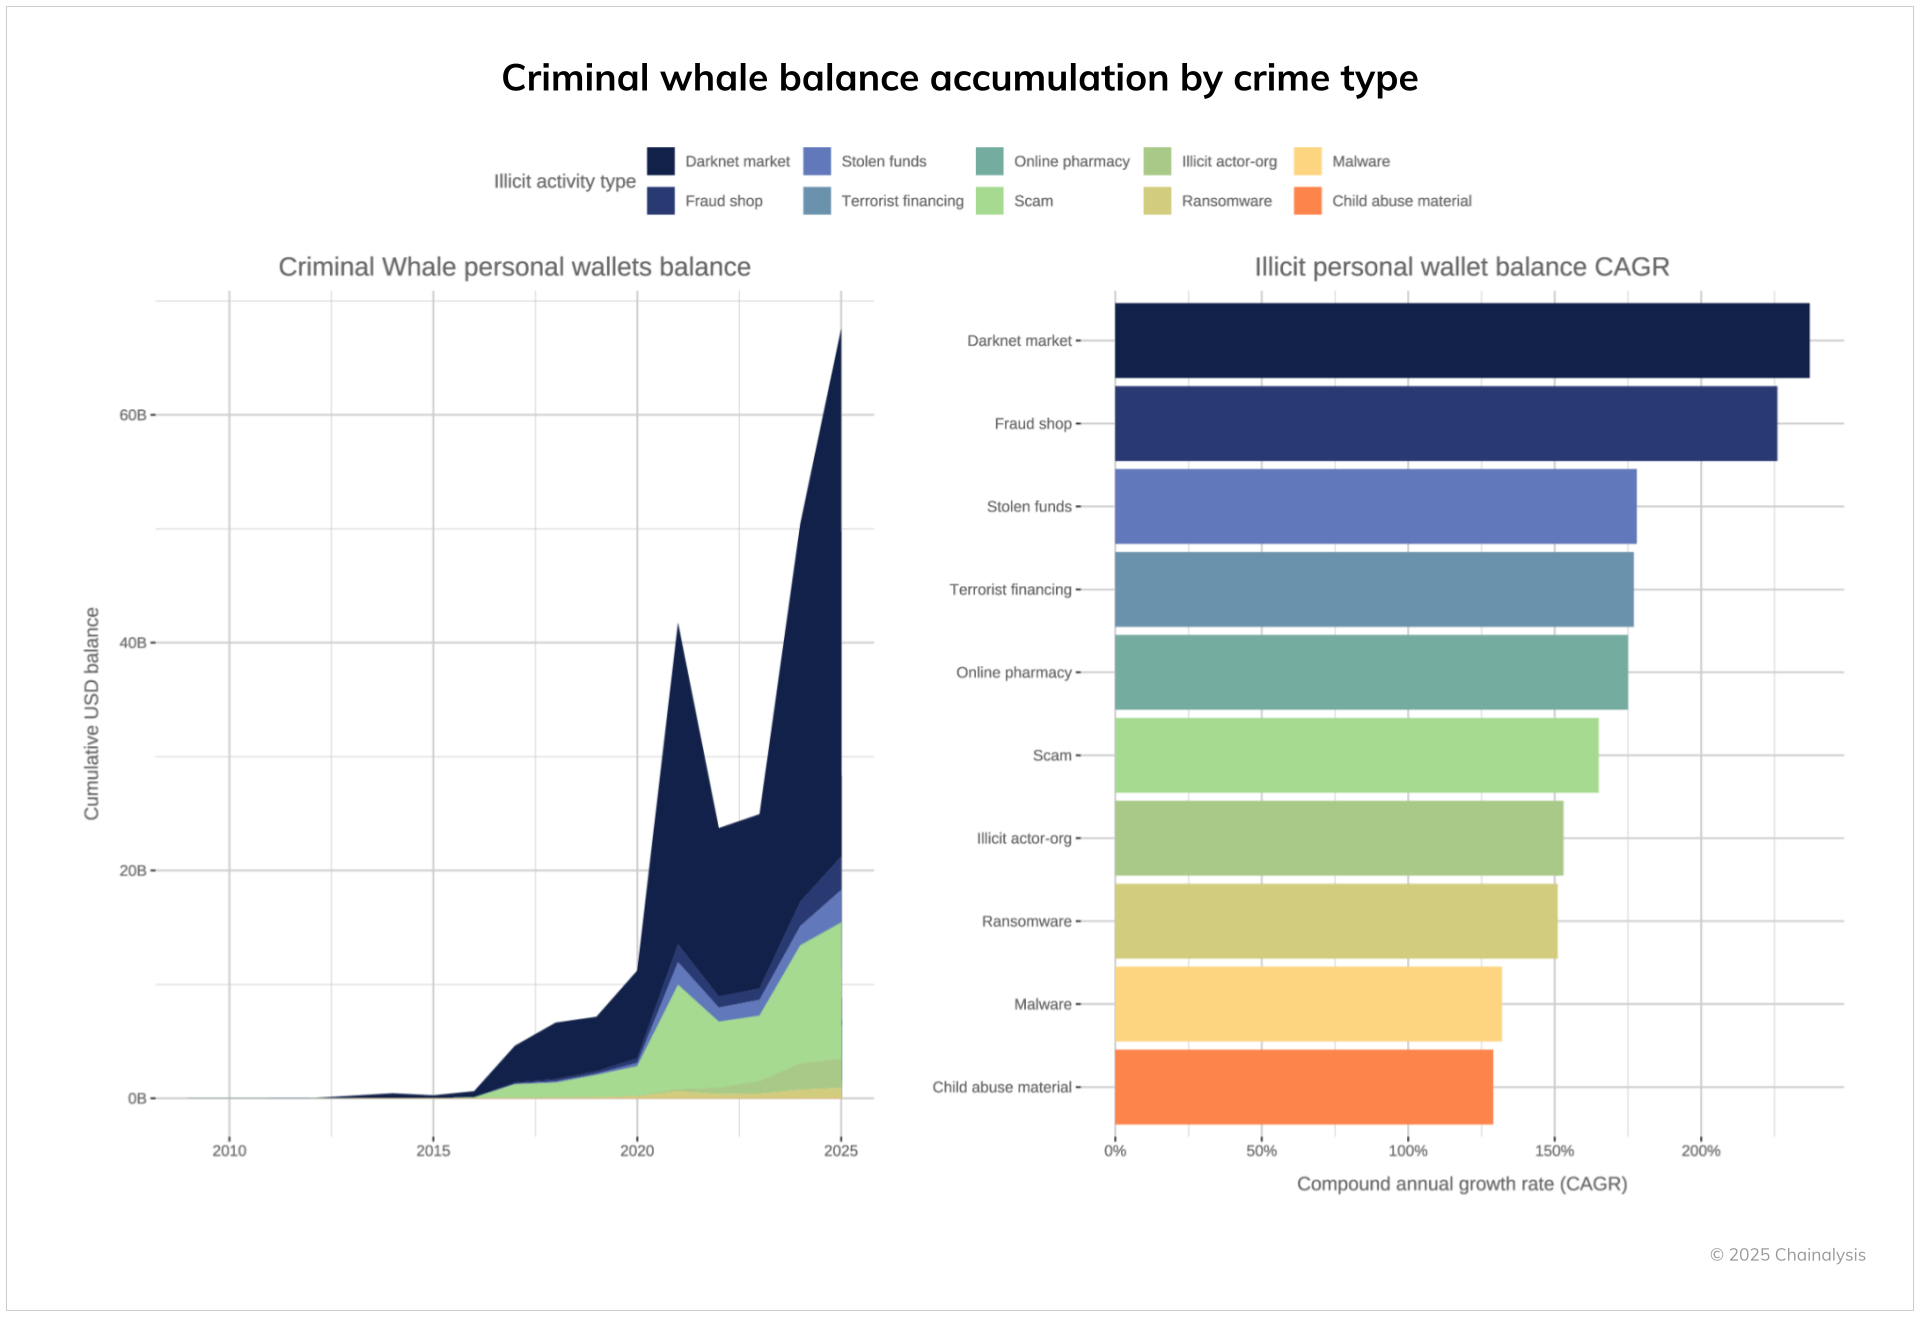
Wallets downstream from darknet markets and scams hold the majority of the $60 billion balance. These sizable sums reflect fundamental differences in how various illicit economies operate.
Darknet markets, which facilitate transactions between buyers and sellers, naturally generate substantial wealth for their vendors and administrators. In fact, these darknet market participants alone control over $46.2 billion in on-chain value, representing the single largest category of illicit downstream wallet holdings. This isn’t surprising, given that darknet markets were among the first to use cryptocurrency, starting with Silk Road back in 2011. Many of these downstream wallet balances have benefited from years of rapid price appreciation – and targets of successful seizures.
Additionally, some money laundering platforms, such as Black U launderers, act as transit points for funds, moving value through a variety of infrastructure points, which means that the total amount of downstream wallet holdings could be even higher than this analysis suggests.
Overall, the growth rate of the balances held by these illicit downstream wallets is staggering. Darknet market admin and vendor wallets show a compound annual growth rate (CAGR) exceeding 200%, followed closely by fraud shops.
Exchange flows: A declining but persistent off-ramp
Centralized exchanges (CEXs) remain the preferred choice for criminals seeking to convert crypto to fiat, but how they do this is evolving rapidly. When funds from an illicit wallet are sent to a CEX, they are potentially seizable if the CEX can identify and act on them. Chainalysis KYT is built to alert compliance teams in real time when such funds arrive, enabling faster intervention and potential seizure by law enforcement. To quantify this seizable total, we can measure inflows to exchanges from all illicit sources. Overall, flows from illicit sources to CEXs neared $7B billion in the first half of 2025 and have averaged over $14 billion in inflows from illicit sources per year since 2020.
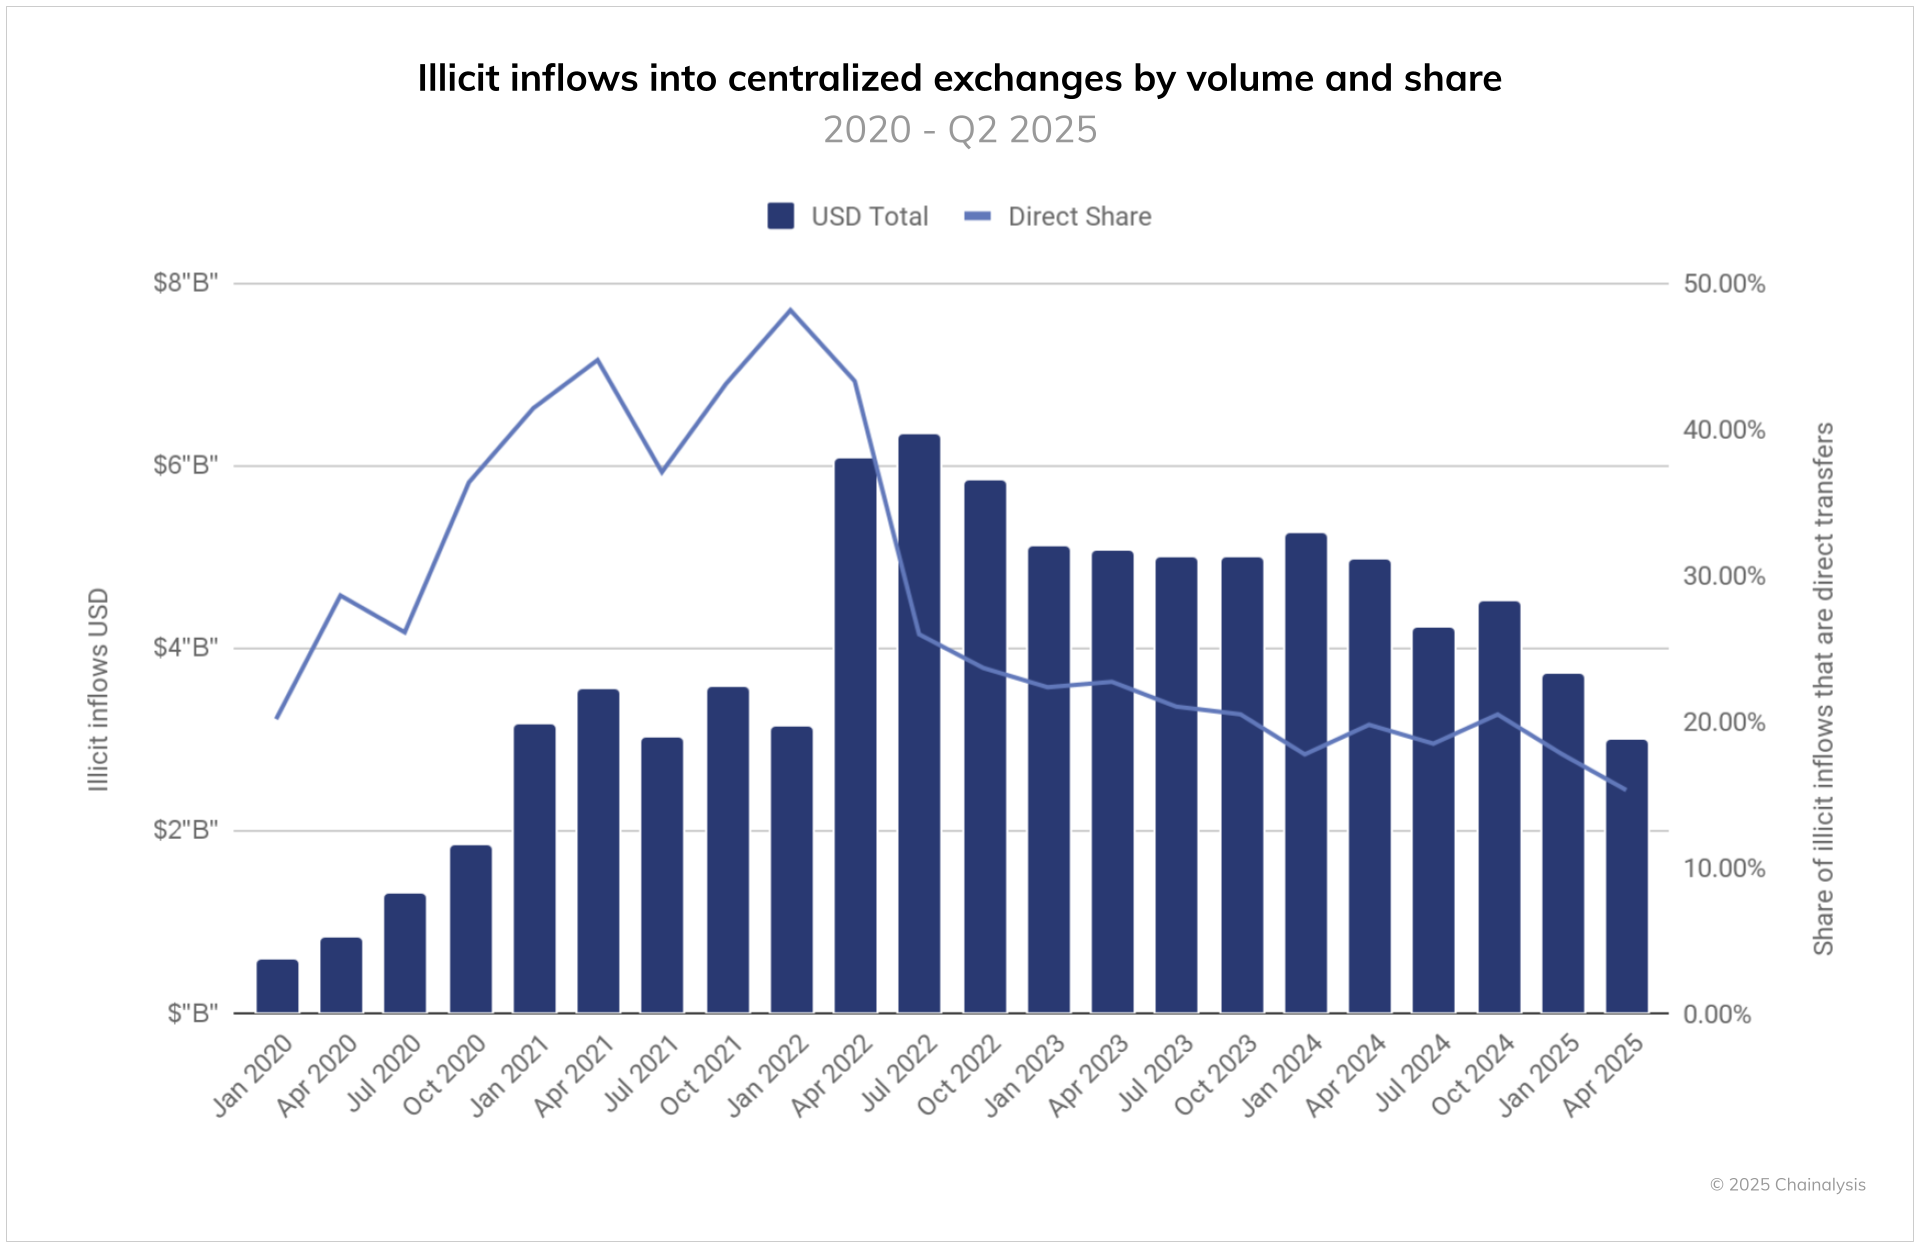
Two other significant trends emerge from the data. First, flows to exchanges are trending downward over time (particularly into 2025), suggesting that illicit actors increasingly recognize that crypto provides utility as a payment method and can act as a store of value. Both utilities reduce the need to convert ill-gotten gains into fiat currencies via exchanges.
Second, the share of direct transfers from illicit entities to exchanges has declined significantly over time. Starting from over 40% of flows in 2021 to 2022, direct transfers now represent around 15% of illicit exchange deposits. This dramatic shift indicates that criminals have adapted to exchange compliance efforts by introducing additional layering steps between their operations and cash-out points, such as the use of mixers and cross-chain bridges. Fortunately, investigators can use Reactor to clearly map cross-chain flows.
Where are balances being held?
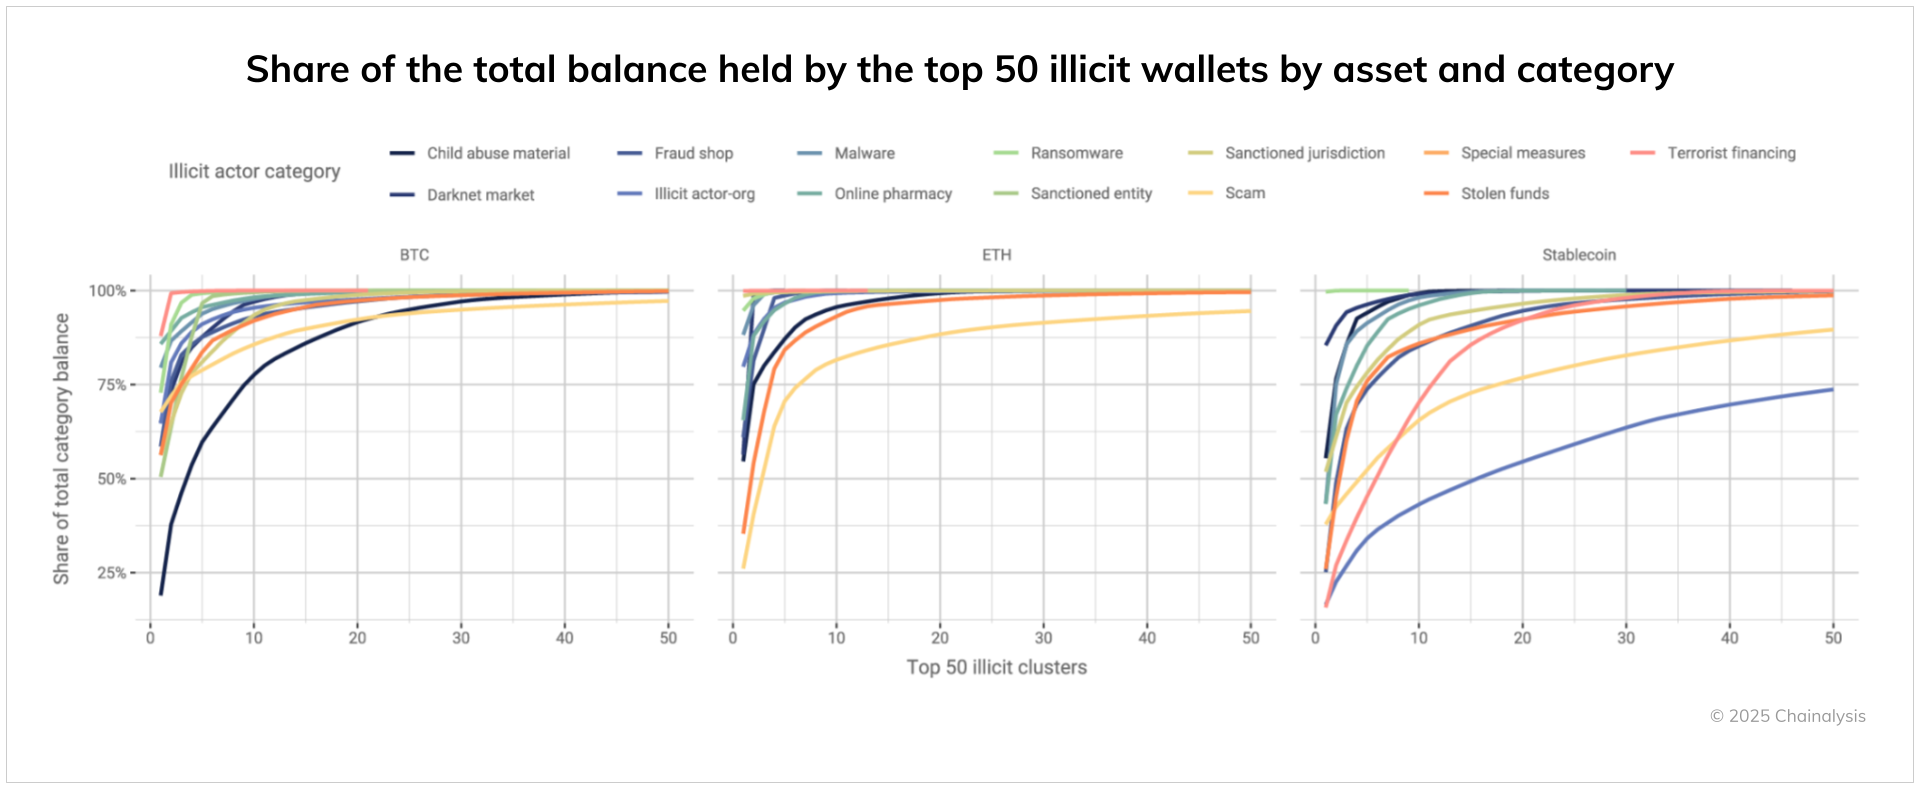
Entities and actors behind different types of illicit activities hold their balances in different ways. In most illicit activity categories (e.g. stolen funds, ransomware, and darknet markets), over 50% of balances are concentrated in a list of top three wallets. There are only two exceptions: terrorist financing, which is often distributed across multiple wallets, potentially because of its transient nature and funding mechanisms, and child abuse material, which recently saw a significant increase in Chinese language CSAM vendors, creating a more regionalized CSAM ecosystem.
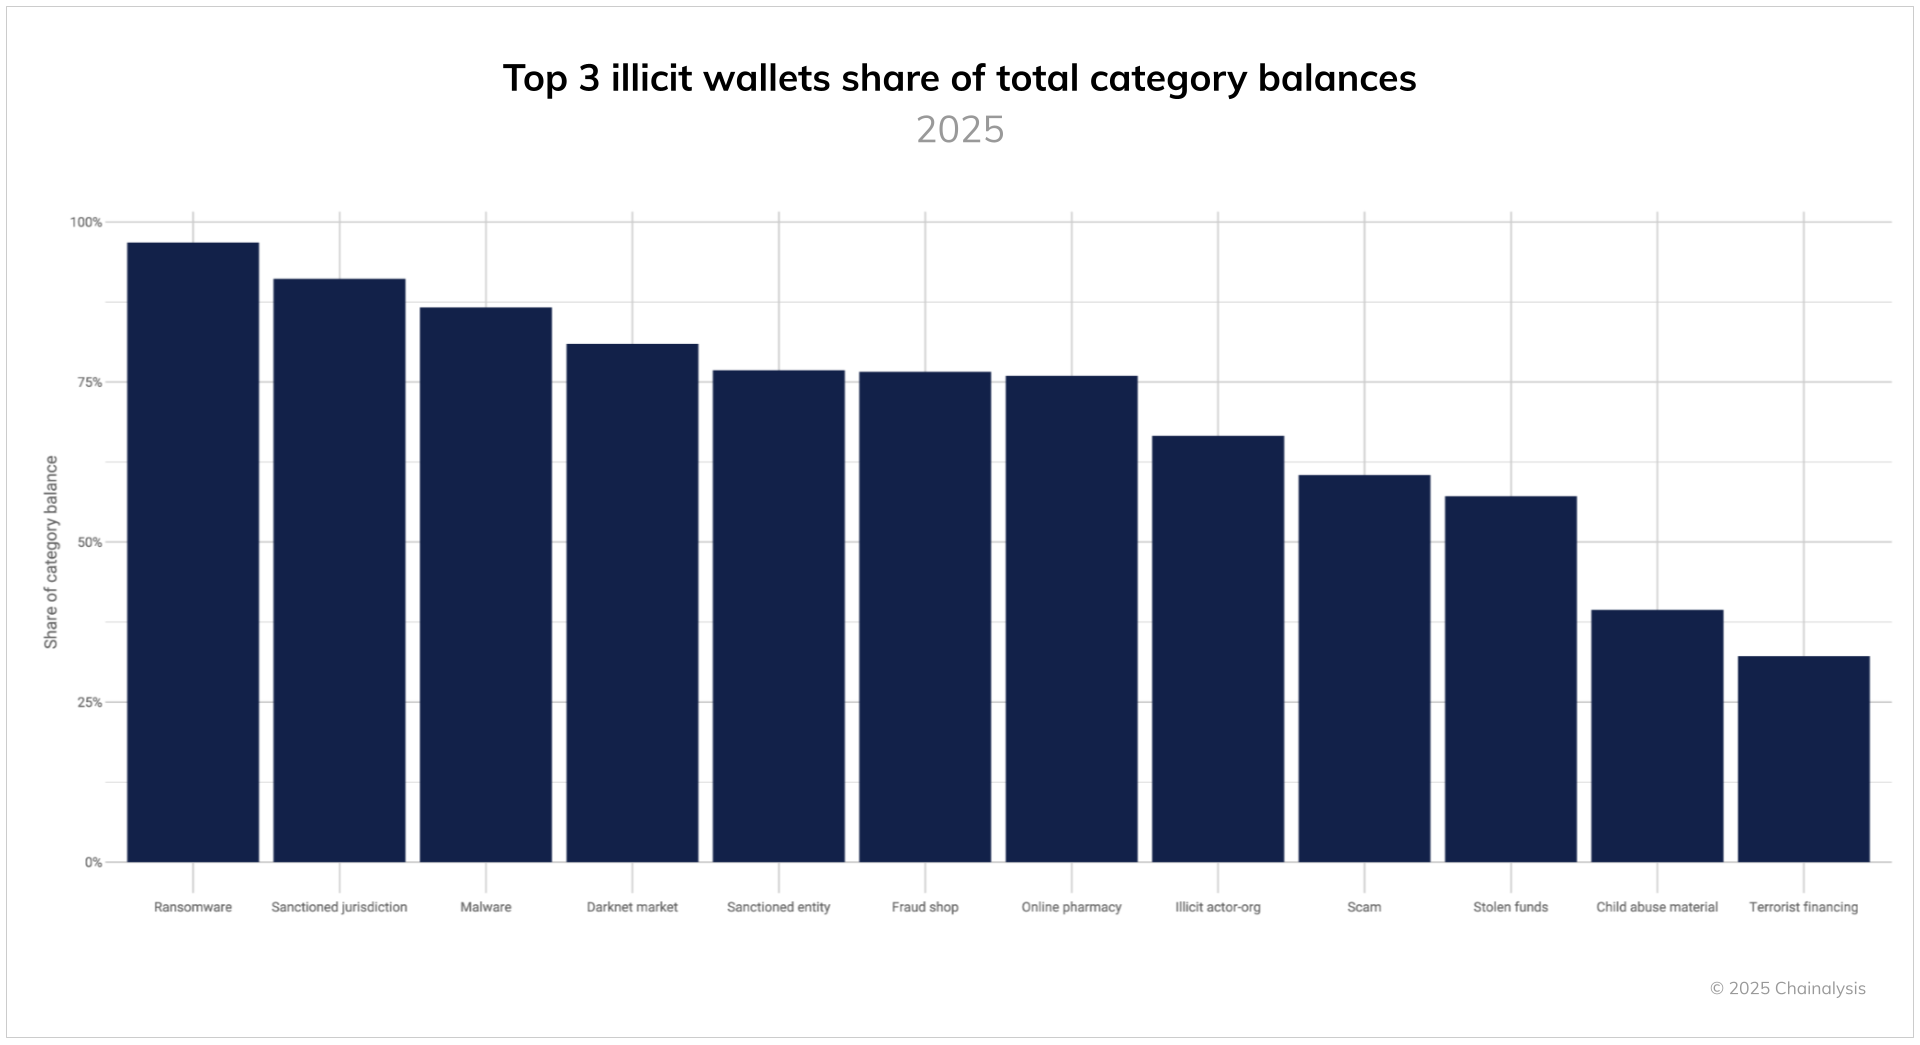
Asset type adds another dimension to concentration patterns. Stablecoins consistently show less concentration than BTC or ETH across categories. This likely reflects a degree of risk management by criminals — stablecoins can be frozen by centralized issuers if linked to illicit activity, incentivizing criminals to spread holdings across more wallets to minimize potential losses from any single point of failure. Additionally, they may be incentivized to convert stablecoin balances either to fiat or other permissionless assets, such as bitcoin.
Illicit actor cashout infrastructure shows adaptive behavior
When we look at cashout infrastructure, we see that criminals are evolving quickly, likely to keep pace with enforcement pressure. Our analysis reveals that over time some criminals are distributing their funds across more deposit addresses within CEXs to cash out, while others are moving in the opposite direction, relying more and more heavily on a concentrated cash out infrastructure.
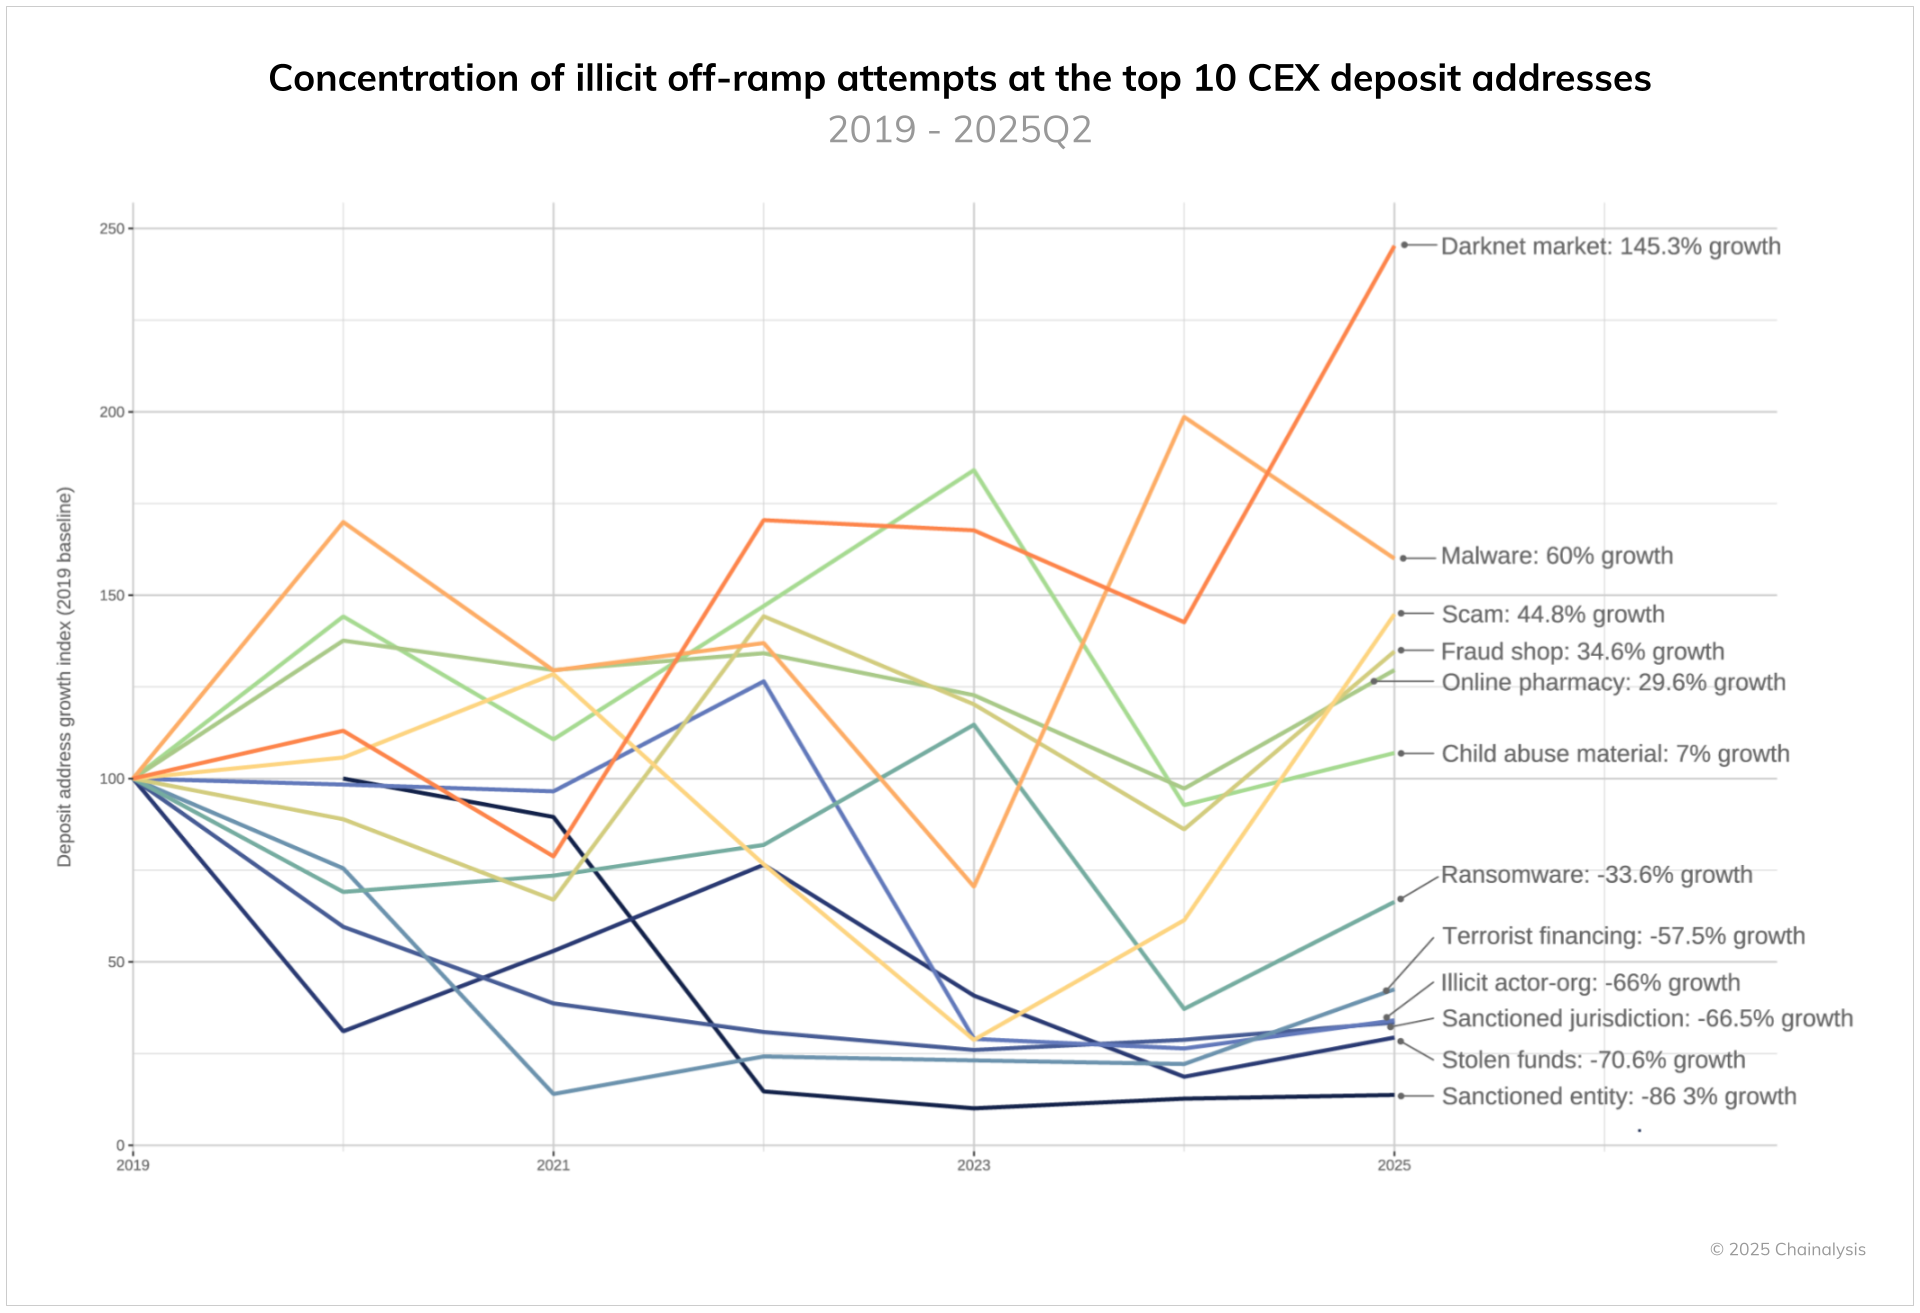
Overall, only six categories show growing concentration in their use of the top 10 exchange deposit addresses. Darknet markets lead with 146% growth in concentration, followed by malware at 60% and scams at 44.8%. This suggests that these operations have identified reliable cash-out routes. The concentrated use of deposit addresses seen in these categories might also be a downstream consequence of the concentration of activity within the illicit entities themselves. For example, the darknet market ecosystem is notoriously centralized, with one market (currently Kraken Darknet market) usually making up the majority of transaction activity on-chain.
Conversely, many categories of illicit activity show significant declines in deposit address concentration since 2019. In our centralized exchange category, sanctioned entities show the steepest decline at -86%, followed by stolen funds at -70%. These declines likely reflect both increased enforcement attention on these categories and improved exchange compliance programs flagging suspicious concentration patterns and inflows from illicit sources.
The trend toward deconcentration aligns with the decline in direct transfers noted earlier. Criminal operations are not only adding layering steps to their laundering efforts, but also diversifying their cash-out infrastructure to avoid detection and account closures.
Deposit address turnover accelerates
Perhaps no metric better captures criminals’ adaptation to enforcement than the dramatic decline in deposit address reuse. Looking at cohorts of addresses by when they were first used for illicit cash-outs reveals a striking pattern.
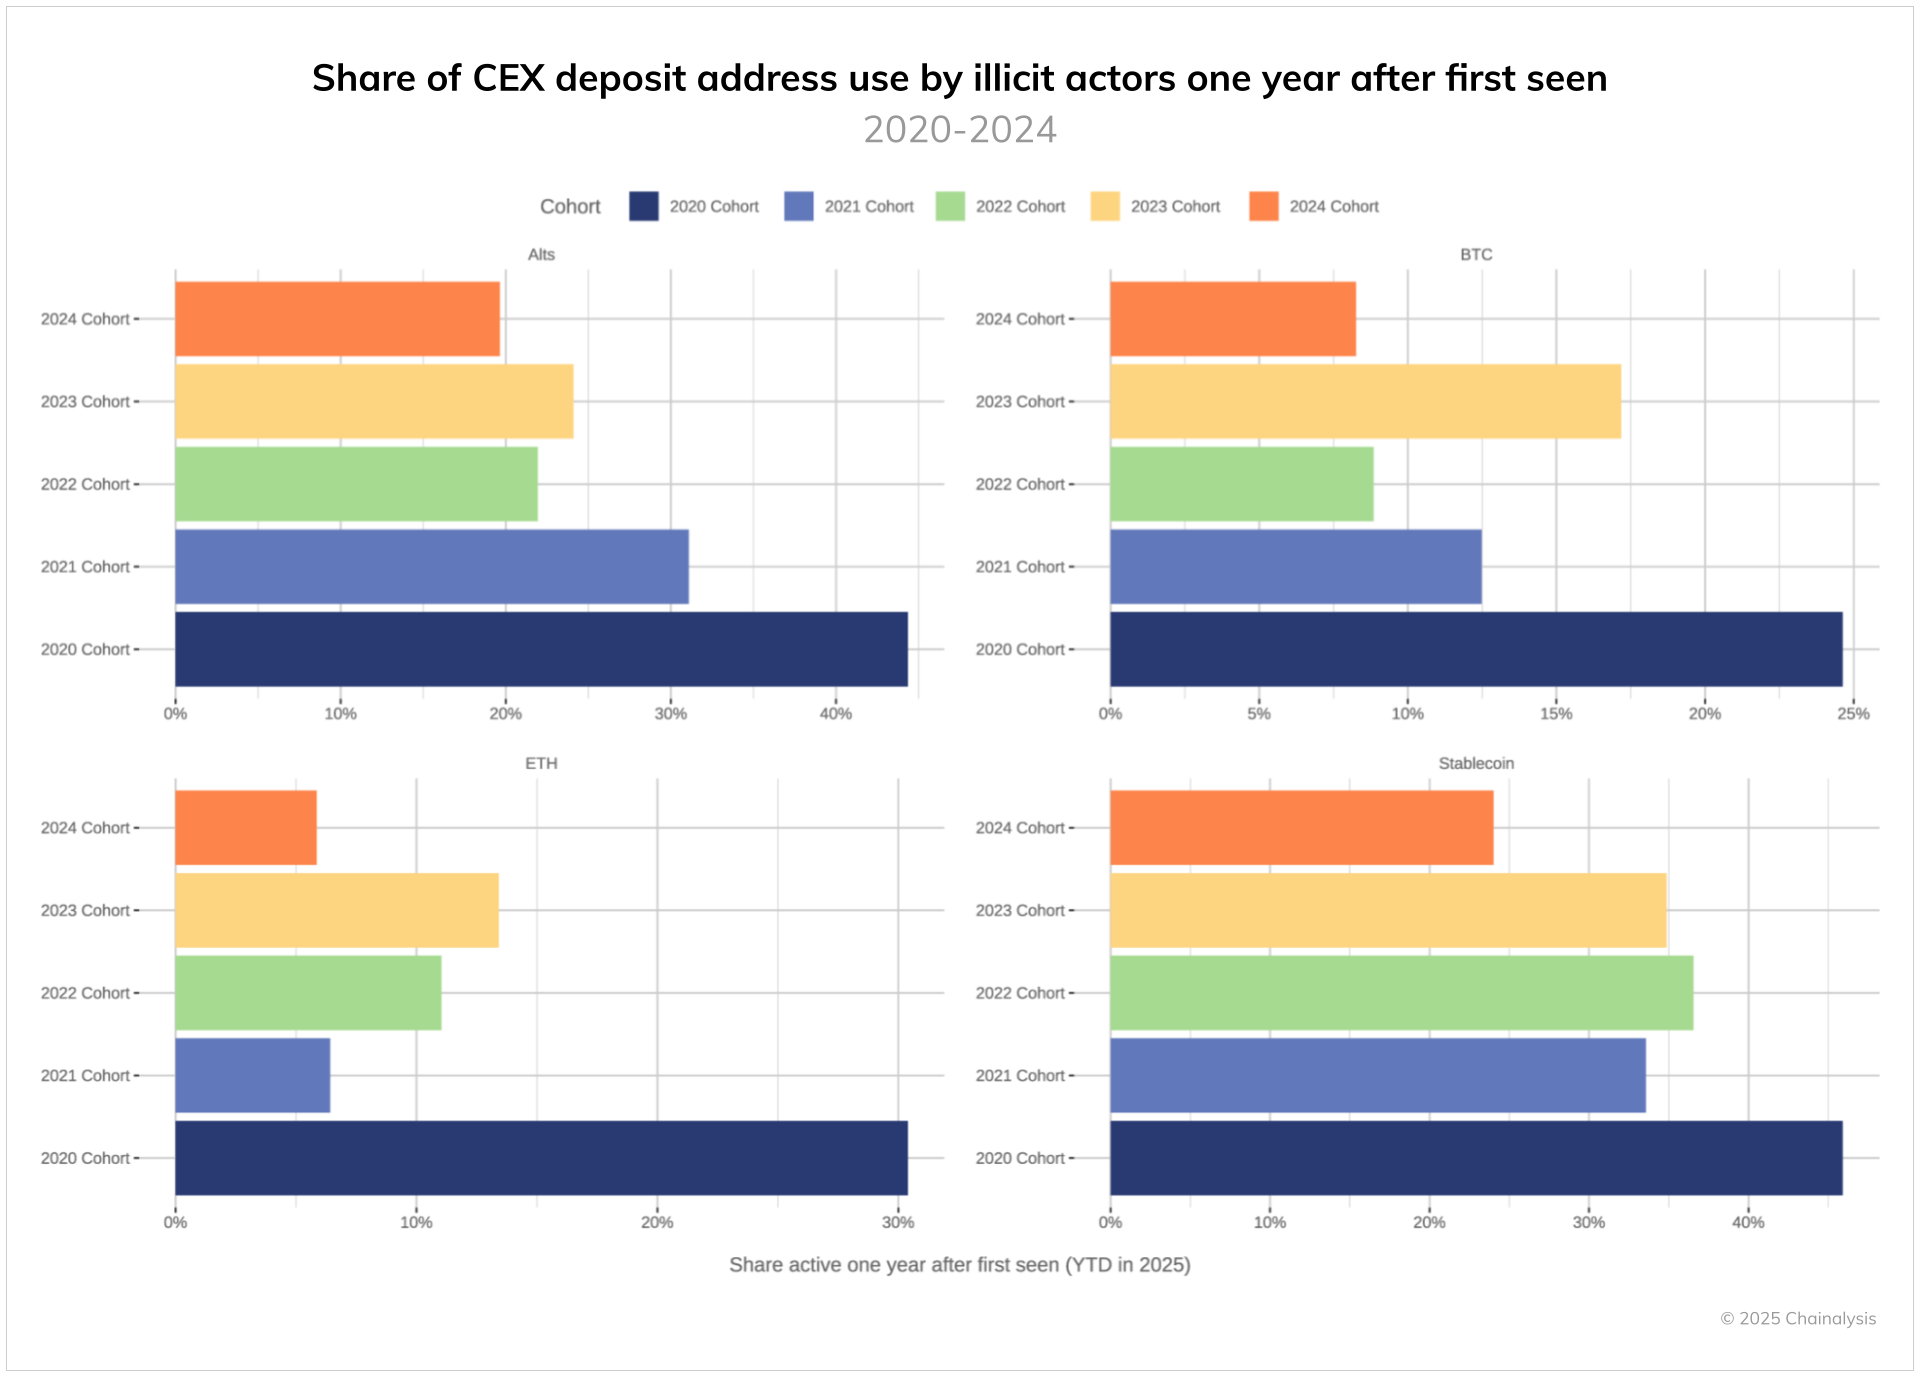
For addresses first used in 2020, between 24% and 46% were still being used to cash out illicit funds one year later, with some variation depending on the asset. This relatively high reuse rate suggests that illicit entities found stable cash-out infrastructure during this period and reused that infrastructure repeatedly. However, for more recent cohorts, reuse rates have trended downward. The implication is that rather than re-using specific exchange accounts, criminal cash-out infrastructure now turns over at a higher rate than before, potentially in an effort to evade CEX compliance efforts.
The pattern holds across all major assets — bitcoin, ether, altcoins, and stablecoins — suggesting that this is a systemic adaptation rather than an asset-specific phenomenon. For law enforcement, this means that the window for identifying and freezing assets at exchanges continues to narrow, requiring faster information sharing and response times, all of which can be facilitated by dedicated compliance teams deploying automated alerting tools. Chainalysis supports this effort through KYT, which enables real-time compliance alerts, and Reactor, which provides investigative tools to trace and respond to illicit activity more effectively. Additionally, our community features within these products enable customers to share intelligence more efficiently.
Windows of Opportunity: Data-driven insights for asset seizure
Beyond understanding what criminals hold, blockchain analysis provides unique insights into when enforcement actions might be possible. Below we discuss how long law enforcement might be able to expect illicit entities to operate and how long these entities might take to cash out their ill-gotten gains after shutting down operations.
Operational lifecycles vary by crime type
Understanding how long illicit entities typically operate provides crucial context for enforcement timing. The longer an illicit entity uses on-chain infrastructure, the larger the targeting window for law enforcement. The chart below shows the wide range of predicted lifespans of illicit entities by category. In some categories, 50% of illicit entities are expected to live on-chain for only the same day as their initial activity. In other categories, the lifespan for 50% can reach as high as 959 days.

Episodic crimes, such as stolen fund activity or ransomware attacks, show the shortest lifespans with 50% of wallets receiving no additional inflows after the initial heist or use as a laundering waypoint. This reflects the on-chain nature of these crimes, where wallet infrastructure is rarely reused beyond the initial incident.
Market-based illicit entities show remarkable persistence. Darknet markets, online pharmacies, and fraud shops commonly operate for 807 to 959 days, with 50% still active during these time frames. These entities benefit from network effects and established reputations that incentivize longevity. The survival curves show gradual decline rather than sharp drops, suggesting that the entities within these categories often persist for longer durations until they either close voluntarily, are shuttered by law enforcement, or exit scam with user funds.
Other categories, such as terrorist financing operations, fall between these extremes, showing 50% survival rates at 54 days. Relative to some of the market-based crimes noted above, this indicates short-lived efforts, often resulting from the high level of attention terror financing campaigns garner, and quick law enforcement actions to disrupt.
Post-operation liquidation velocity varies by asset and actor
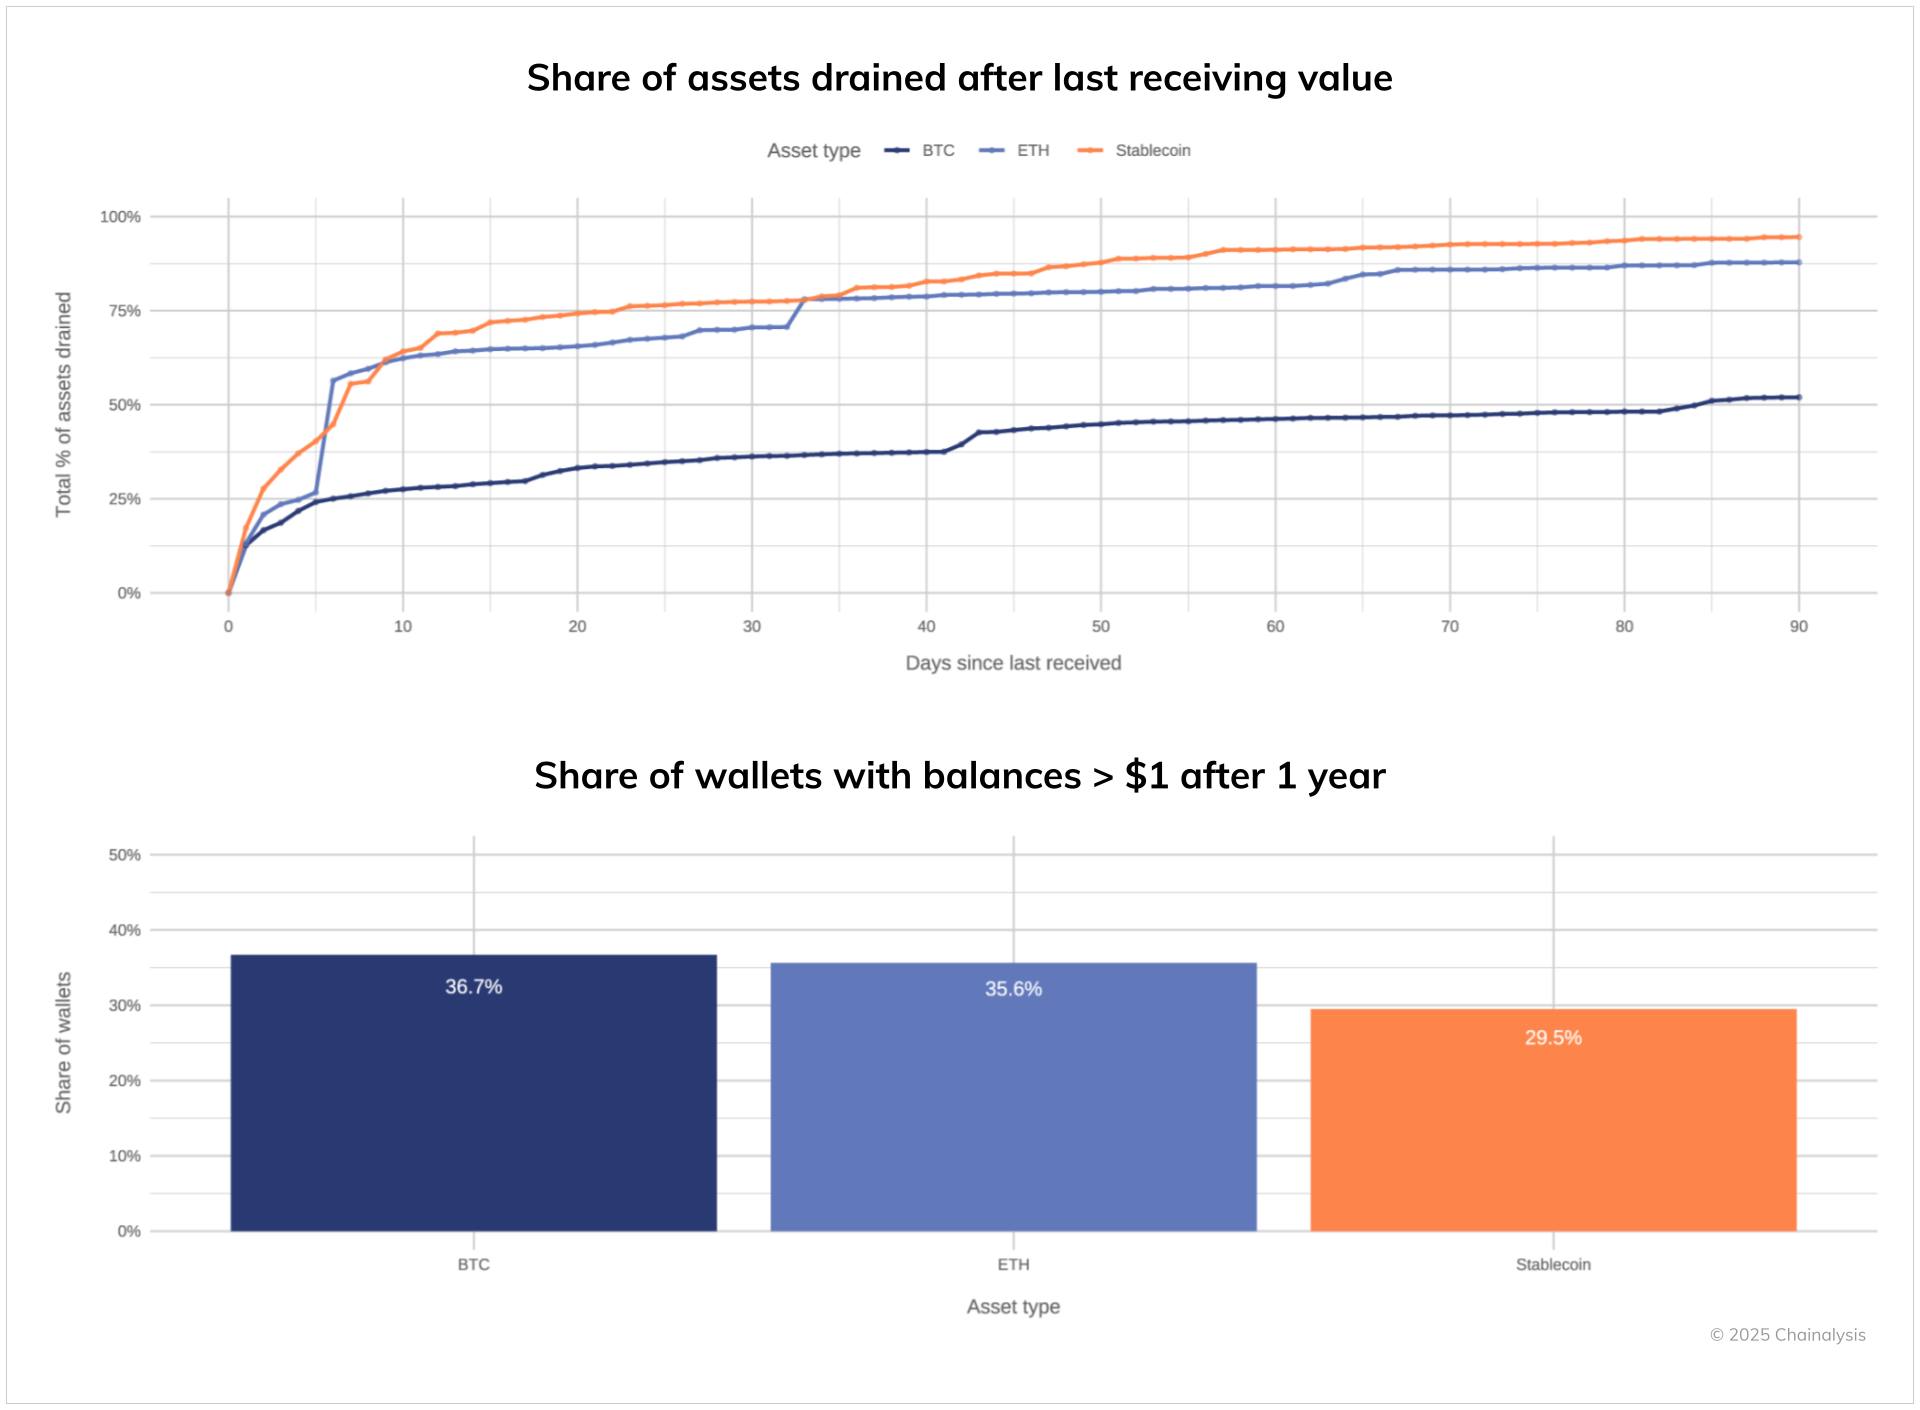
We can also time stamp when illicit entities last received funds and calculate how long it took to drain any balances that were inherited at the time when the entity stopped using its on-chain wallet infrastructure. After ceasing operations, illicit entities show markedly different behaviors, depending on which cryptocurrencies they hold. As our analysis reveals, stablecoins are liquidated with urgency — nearly 95% of these assets are drained within just 90 days after the last inflow, with only 29.5% of wallets maintaining any stablecoin balance after one year.
Ethereum follows a more measured pattern, with approximately 87% of ETH holdings moved within 90 days, though a significant 35.6% of wallets retain ETH balances beyond the one-year mark. Most notably, bitcoin demonstrates exceptional staying power, with criminals moving only about 52% of their BTC within the first 90 days, and 36.7% of wallets still maintaining bitcoin balances after a full year.
These divergent liquidation velocities suggest that, while criminals treat stablecoins as high-risk assets requiring immediate conversion, they appear to view bitcoin — and to a lesser extent ether — as potential long-term value stores, despite their traceability. For investigators, this creates a critical but narrow window of opportunity for stablecoin recovery, while potentially allowing a more extended timeframe for pursuing bitcoin holdings.
Implications for law enforcement and policy
The scale of seizable assets — $15 billion in illicit entity balances and $60 billion in downstream wallets — presents a significant opportunity for asset recovery, albeit with distinct challenges. While centralized stablecoins can be frozen by issuers, confiscating BTC and other permissionless cryptocurrencies requires either obtaining private keys or intercepting funds at centralized off-ramps.
To effectively capture these assets, governments and authorities need comprehensive strategies including:
- expedited seizure powers for time-critical investigations;
- strong cross-border cooperation frameworks and information-sharing agreements;
- and technical capacity building with blockchain analytics tools and specialized expertise.
Without these elements — clear legal authority, streamlined international cooperation, and investment in technical capabilities — the substantial recovery opportunities identified in this research will remain largely unrealized.
Given this, Chainalysis recognizes the growing need for a data-driven approach to tracking illicit funds and threat actors at scale. With finite resources, agencies must focus on the most impactful leads. Chainalysis Data Solutions, one of our fastest-growing offerings, empowers organizations to analyze entire threat landscapes, identify strategic opportunities, and prioritize actionable leads. Once leads are triaged, investigators can dive deeper in Reactor to trace funds and build cases. In addition to our products, leveraging our Global Services team, which has supported law enforcement and government partners for years with hands-on asset seizure support and expert investigative guidance, has yielded significant results.
Ready to speak to someone at Chainalysis today about our data capabilities? Request a demo here.
This website contains links to third-party sites that are not under the control of Chainalysis, Inc. or its affiliates (collectively “Chainalysis”). Access to such information does not imply association with, endorsement of, approval of, or recommendation by Chainalysis of the site or its operators, and Chainalysis is not responsible for the products, services, or other content hosted therein.
This material is for informational purposes only, and is not intended to provide legal, tax, financial, or investment advice. Recipients should consult their own advisors before making these types of decisions. Chainalysis has no responsibility or liability for any decision made or any other acts or omissions in connection with Recipient’s use of this material.
Chainalysis does not guarantee or warrant the accuracy, completeness, timeliness, suitability or validity of the information in this report and will not be responsible for any claim attributable to errors, omissions, or other inaccuracies of any part of such material.


