
Each week, we share a data-driven snapshot of the most compelling trends in digital assets through our “Chart of the Week” series on social media. Drawing from first-in-class Chainalysis data, these visualizations capture key moments and movements that are shaping the crypto ecosystem. Below are the charts we featured in July 2025.
If you want to see these charts as they go live each week, follow us on LinkedIn, X, and Telegram.
BlackRock’s BUIDL fund sees 300% growth in 2024
BlackRock’s BUIDL Institutional Digital Liquidity Fund has demonstrated remarkable growth in 2024, with its market capitalization surging from approximately $650 million to nearly $3 billion, marking a more than 300% increase. This exceptional performance can be attributed to several key factors: accelerating institutional adoption, successful integration with the Solana ecosystem, persistent macroeconomic uncertainty, and stable Federal Reserve monetary policy.

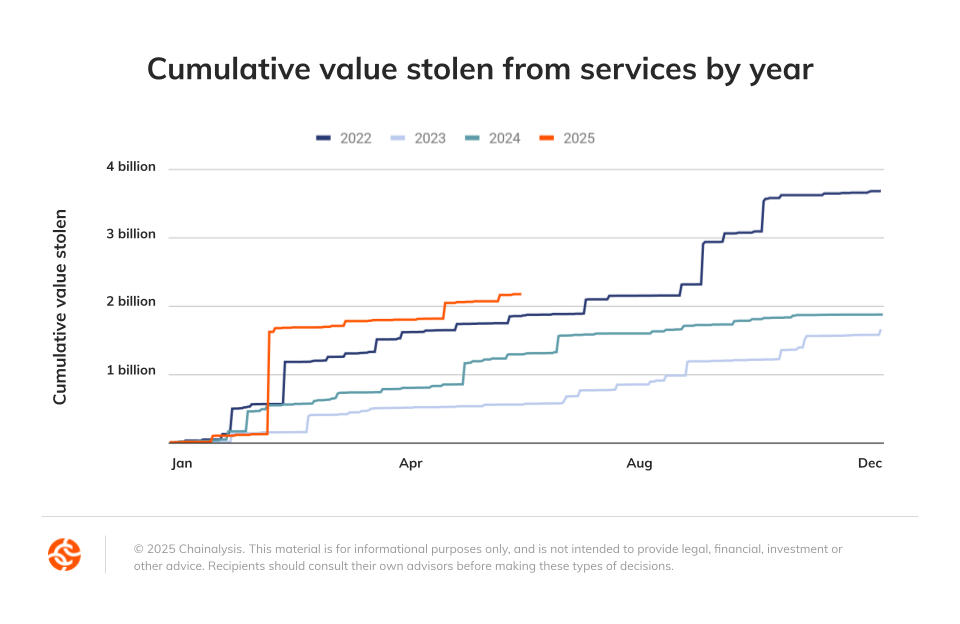
Mid-year crime update: Service thefts hit $2.17 billion
Value stolen from services cracked $2.17 billion in the first half of 2025 and is trending toward the worst year on record. But service compromises tell only part of the story. Our mid-year crime update details the growing trend of personal wallet compromises, which make up a larger and larger share of all value stolen each year.
Pump.fun’s record-breaking ICO signals market maturity
The recent Pump.fun ICO has made history by raising an impressive $600 million in less than 15 minutes, making it the third-largest ICO ever and matching Circle’s initial IPO target. Ranking as the 8th largest public offering of any kind this year, this milestone demonstrates the growing convergence between traditional financial markets and crypto. Beyond the numbers, it signals an important shift in market maturity—showing that major capital formation isn’t limited to blockchain infrastructure, but now extends to cultural narratives and broader crypto use cases.

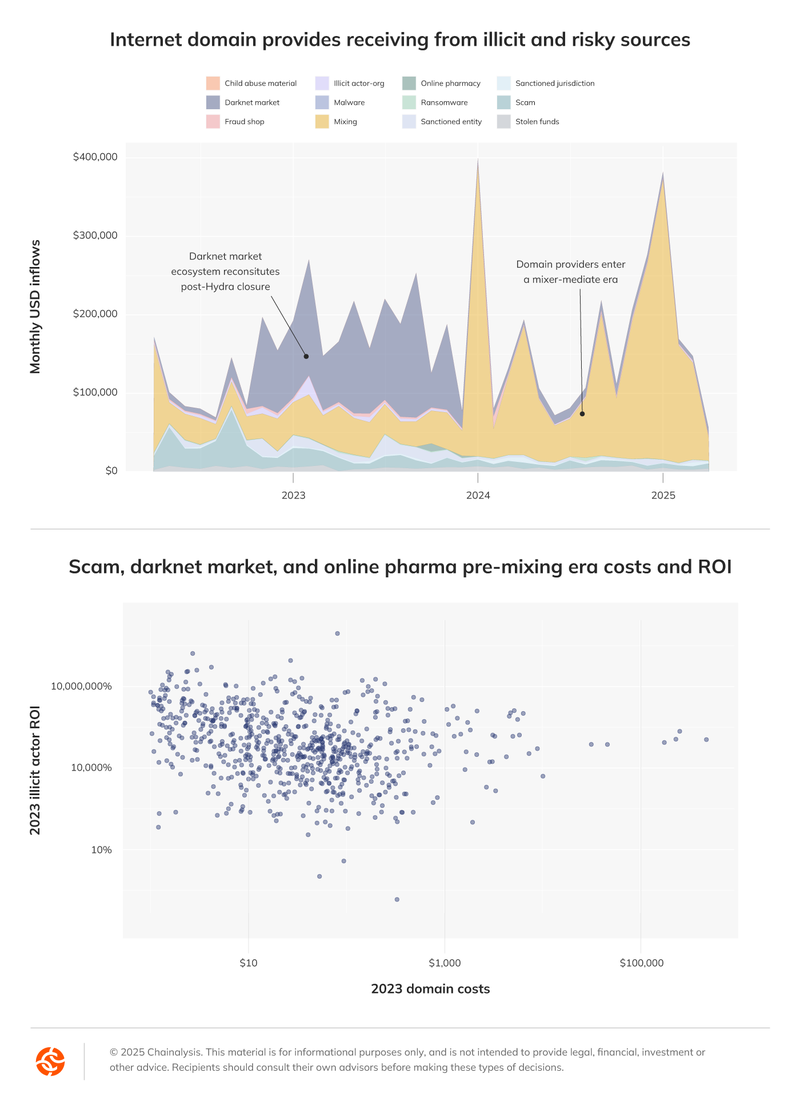
Criminal ROI: The growing abuse of domain services
Our analysis reveals alarming trends in how illicit actors are exploiting legitimate domain services, with cryptocurrency mixers increasingly serving as intermediaries for criminal transactions. The ROI analysis is striking: darknet markets achieve a median 700,000% return, while scam operations generate over 82,000% returns, both requiring minimal domain infrastructure investment. In the post-Hydra landscape, these trends highlight the growing challenge of protecting legitimate web services from criminal exploitation.
Bitcoin’s 16-year evolution shows remarkable growth metrics
Following the release of the White House’s Digital Assets Report, an analysis of bitcoin’s 16-year history reveals its dramatic transformation from a niche technology to a global financial force. The data highlights bitcoin’s substantial growth across key metrics, now processing over $600 billion in monthly transaction volume and facilitating more than 20 million monthly transactions. The network serves approximately 4 million active monthly users, and the average USD transfer size has increased 137% since the start of 2024.

To learn more about our data capabilities, request a demo here.
本ウェブサイトには、Chainalysis, Inc. およびその関連会社(以下、総称して「Chainalysis」)の管理下にない第三者のサイトへのリンクが含まれています。当該情報へのアクセスは、Chainalysis が当該サイトまたはその運営者との提携、支持、承認、または推奨を行っていることを意味するものではなく、Chainalysis は、当該サイトで提供される製品、サービス、その他のコンテンツについて一切の責任を負いません。
本資料は情報提供のみを目的としており、法律、税務、財務、または投資に関する助言を提供するものではありません。受領者は、こうした決定を行う前に、各自のアドバイザーに相談してください。Chainalysis は、受領者が本資料を利用したことに起因する、つながり におけるいかなる決定、その他の作為または不作為についても、一切の責任を負いません。
Chainalysis 当社は、本報告書に記載された情報の正確性、完全性、適時性、適合性、または有効性を保証するものではなく、当該資料のいかなる部分における誤り、欠落、またはその他の不正確さに起因するいかなる請求についても責任を負いません。


