This post is an excerpt from our 2023 Geography of Cryptocurrency Report. Download your copy now!
We’re excited to unveil the fourth annual Chainalysis Global Crypto Adoption Index. The goal of the index is simple: We combine on-chain data and real-world data to measure which countries are leading the world in grassroots crypto adoption. Grassroots crypto adoption isn’t about which countries have the highest raw transaction volumes — anyone could probably guess that the biggest, wealthiest countries are far ahead there. Instead, we want to highlight the countries where average, everyday people are embracing crypto the most. To do that, we’ve designed the Global Crypto Adoption Index to identify countries where the most people are putting the greatest share of their wealth into cryptocurrency. We’ll explain the full methodology below, then provide the top 20 countries on our index, along with a few key takeaways.
Keep reading, and we’ll discuss:
- Our methodology for the Global Crypto Adoption Index
- The top 20 countries on our Global Crypto Adoption Index for 2023
- Key takeaways from the index
Our Global Crypto Adoption Index methodology
The Global Crypto Adoption Index is made up of five sub-indexes. Each of those sub-indexes is based on countries’ usage of different types of cryptocurrency services. We rank all 154 countries for which we have sufficient data on each sub-index, weight the rankings by characteristics like population size and purchasing power, take the geometric mean of each country’s ranking in all five, and then normalize that final number on a scale of 0 to 1 to give every country a score that determines the overall rankings. The closer the country’s final score is to 1, the higher the rank.
In order to calculate our sub-indexes, we estimate countries’ transaction volumes for different types of cryptocurrency services and protocols based on the web traffic patterns of those services’ and protocols’ websites. We acknowledge that web traffic data isn’t perfect. Some crypto users are almost certainly employing VPNs and other tools that mask online activity. But given that our index takes into account hundreds of millions of transactions and 13 billion web visits, we’re confident that any misattributed transaction volume due to VPNs is too small to compromise the data as a whole. We also vet our index with local crypto experts and operators around the world, giving us more confidence in this methodology.
Below is a description of each sub-index, how it’s calculated, and why we believe it’s valuable for measuring grassroots crypto adoption.
On-chain cryptocurrency value received at centralized exchanges, weighted by purchasing power parity (PPP) per capita
The goal of this sub-index is to rank each country by total cryptocurrency activity occurring on centralized crypto exchanges, and weight the rankings to favor countries where that amount is more significant based on the income of the average person in that country. We calculate this by estimating the total cryptocurrency received on-chain by users of centralized services in each country, and weighting that value based on PPP per capita, which is a measure of the country’s income per resident. The higher the ratio of on-chain value received to PPP per capita, the higher the ranking. In other words, if two countries received equal amounts of cryptocurrency at centralized services, the country with lower PPP per capita would rank ahead.
On-chain retail value received at centralized exchanges, weighted by PPP per capita
The goal of this metric is to measure the activity of non-professional, individual cryptocurrency users at centralized services, based on how much cryptocurrency they’re transacting compared to the purchasing power of the average person. We do this by measuring the amount of cryptocurrency received at centralized services by users in each country, similar to the above, but only counting value received in retail-sized transactions, which we designate as transactions under $10,000 USD worth of cryptocurrency. We then rank each country according to this metric but weight it to favor countries with a lower PPP per capita.
Peer-to-peer (P2P) exchange trade volume, weighted by PPP per capita and number of internet users
P2P trade volume makes up a significant percentage of all cryptocurrency activity in emerging markets. For this sub-index, we rank countries by their P2P trade volume and weight it to favor countries with lower PPP per capita and fewer internet users, the goal being to highlight countries where more residents are putting a larger share of their overall income and wealth into P2P cryptocurrency transactions.
On-chain cryptocurrency value received from DeFi protocols, weighted by PPP per capita
DeFi (decentralized finance) is the cutting edge of cryptocurrency. Given the sector’s importance to innovation in crypto, we want our adoption index to highlight countries where users are conducting a disproportionately high share of their financial activity using DeFi protocols. For this sub-index, we rank countries by their DeFi transaction volume, and weight the rankings to favor countries with lower PPP per capita.
On-chain retail value received from DeFi protocols, weighted by PPP per capita
We want our index to highlight the DeFi activity of non-professional, individual cryptocurrency users, just as we do for centralized services. So, this sub-index ranks each country by DeFi transaction volume carried out in retail-sized transfers, weighted to favor countries with lower PPP per capita.
The 2023 Global Crypto Adoption Index Top 20
| Country | Region | Overall index ranking | Centralized service value received ranking | Retail centralized service value received ranking | P2P exchange trade volume ranking | DeFi value received ranking | Retail DeFi value received ranking |
| India | Central & Southern Asia and Oceania | 1 | 1 | 1 | 5 | 1 | 1 |
| Nigeria | Sub-Saharan Africa | 2 | 3 | 2 | 1 | 4 | 4 |
| Vietnam | Central & Southern Asia and Oceania | 3 | 4 | 4 | 2 | 3 | 3 |
| United States | North America | 4 | 2 | 8 | 12 | 2 | 2 |
| Ukraine | Eastern Europe | 5 | 5 | 3 | 11 | 10 | 10 |
| Philippines | Central & Southern Asia and Oceania | 6 | 6 | 6 | 19 | 7 | 7 |
| Indonesia | Central & Southern Asia and Oceania | 7 | 13 | 13 | 14 | 5 | 5 |
| Pakistan | Central & Southern Asia and Oceania | 8 | 7 | 7 | 9 | 20 | 20 |
| Brazil | Latin America | 9 | 9 | 11 | 15 | 11 | 11 |
| Thailand | Central & Southern Asia and Oceania | 10 | 8 | 15 | 44 | 6 | 6 |
| China | Eastern Asia | 11 | 10 | 5 | 13 | 23 | 23 |
| Turkey | Middle East & North Africa | 12 | 11 | 9 | 35 | 12 | 12 |
| Russia | Eastern Europe | 13 | 12 | 10 | 36 | 9 | 9 |
| United Kingdom | Central, Northern, & Western Europe | 14 | 15 | 20 | 38 | 8 | 8 |
| Argentina | Latin America | 15 | 14 | 12 | 29 | 19 | 19 |
| Mexico | Latin America | 16 | 17 | 18 | 30 | 16 | 16 |
| Bangladesh | Central & Southern Asia and Oceania | 17 | 18 | 19 | 33 | 22 | 22 |
| Japan | Eastern Asia | 18 | 22 | 21 | 49 | 18 | 18 |
| Canada | North America | 19 | 25 | 23 | 62 | 14 | 14 |
| Morocco | Middle East & North Africa | 20 | 27 | 25 | 21 | 26 | 26 |
The first key takeaway here is that the Central & Southern Asia and Oceania (CSAO) region dominates the top of the index, with six of the top ten countries located in the region. As we explore in the full report, the circumstances driving adoption in each CSAO country are unique, which leads to different usage trends and breakdowns of most popular services.
Global adoption is down, but not in one crucial subset of the world
There’s no sugarcoating it: Worldwide grassroots crypto adoption is down. We can see this on the chart below, where we apply our Adoption Index methodology globally by summing all 154 countries’ index scores for each quarter from Q3 2020 to the present, and re-index them again to show adoption growth over time across the world.
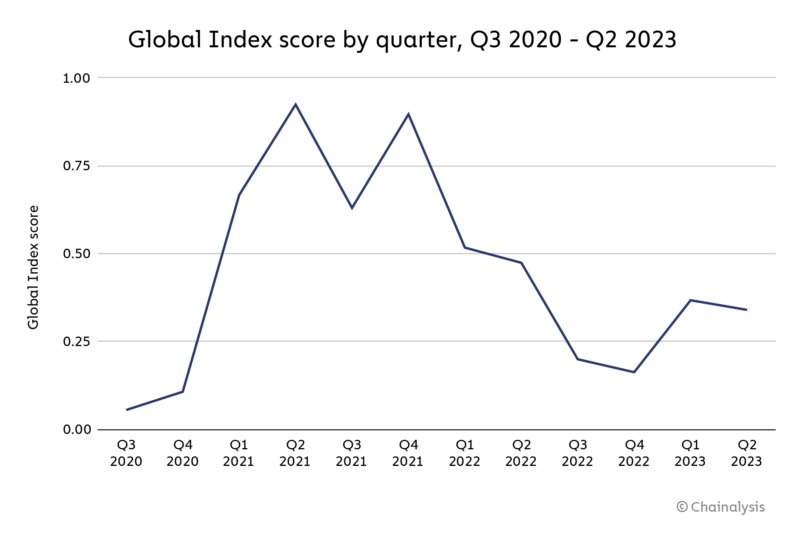
While there’s been a marked recovery since the doldrums of late 2022, around the time FTX imploded, grassroots adoption is still well off its all-time highs.
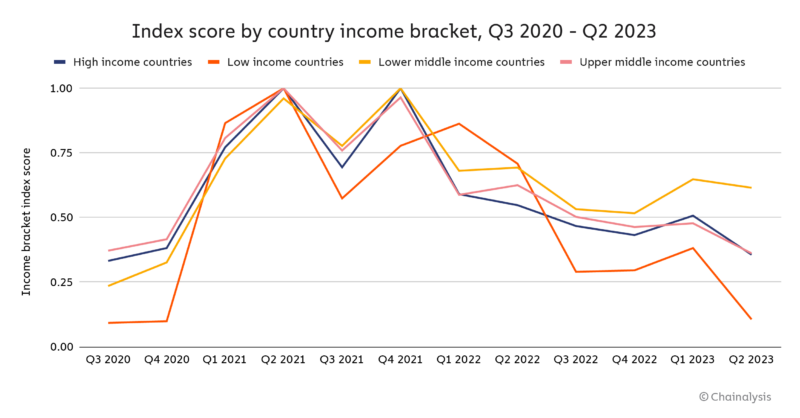
But that isn’t true everywhere. More specifically, there’s one crucial segment of countries where grassroots adoption has seen a much stronger recovery than anywhere else: Lower middle income (LMI) countries. LMI is one of four designations used by the World Bank to classify countries by income level, based on gross national income (GNI) per capita. Those categories are as follows:
| World Bank income classification | GNI per capita range | Example countries |
| High income (HI) | > $13,205 | USA, UK, Saudi Arabia |
| Upper middle income (UMI) | $4,256 – $13,205 | Argentina, China, Russia |
| Lower middle income (LMI) | $1,086 – $4,255 | India, Nigeria, Ukraine |
| Low income (LI) | < $1,085 | Ethiopia, Sudan, Yemen |
Many of the top countries on our Global Crypto Adoption Index, from Central & Southern Asia to Africa, are in the LMI category, and taken together, LMI countries have seen the greatest recovery in grassroots crypto adoption over the last year. In fact, LMI is the only category of countries whose total grassroots adoption remains above where it was in Q3 2020, just prior to the most recent bull market.
This could be extremely promising for crypto’s future prospects. LMI countries are often countries on the rise, with dynamic, growing industries and populations. Many of them have undergone significant economic development in the last few decades to rise from the low income group. And perhaps most importantly of all, 40% of the world’s population live in LMI countries — more than any other income category. If LMI countries are the future, then the data indicates that crypto is going to be a big part of that future. That, combined with the fact that institutional adoption — primarily driven by organizations in high-income countries — continues to gain steam even during the ongoing crypto winter, paints a promising picture of the future. We could see a combination of bottom up and top down cryptocurrency adoption in the near future if these trends hold, as digital assets fulfill the unique needs of individuals in both segments. We’ll explore these trends and more in our full 2023 Geography of Cryptocurrency Report.
This material is for informational purposes only, and is not intended to provide legal, tax, financial, or investment advice. Recipients should consult their own advisors before making these types of decisions. Chainalysis has no responsibility or liability for any decision made or any other acts or omissions in connection with Recipient’s use of this material.