
For most of the research that we publish in our annual Crypto Crime Report, the data tells a clear story. For instance, funds sent to ransomware operators, darknet markets, or sanctioned entities can be measured and trends can be analyzed with Chainalysis labeling and data. But blockchain data can also be used to detect suspicious trading patterns. In these cases, the evidence on the blockchain is less definitive. Instead, on-chain data can provide a starting point for deeper investigations, usually combined with other, off-chain information. For this reason, we do not include possible market manipulation proceeds or estimates of victim losses in our count of total illicit transaction volume — there isn’t enough information to determine whether the activity is criminal or not without additional context.
Pump and dump schemes typically involve an actor or group of actors investing in a token, heavily promoting that token to spur a price increase, and subsequently dumping their holdings at a significant profit. This often results in a heavy decline or even collapse of a token’s price, impacting unsuspecting holders.
For this analysis, we designed a methodology to surface data points that identify potential areas for further investigation into possible market manipulation. We focused on DeFi, given its transparency and the availability of on-chain information, which is not similarly available in centralized trading platforms. Specifically, we looked at the Ethereum network, which has experienced rapid growth and innovation in recent years. Thanks to the ecosystem’s ERC-20 standard, or technical guidelines for Ethereum-based fungible tokens, it’s never been easier to build new tokens on top of Ethereum, with all tokens able to be traded with one another and used on a variety of decentralized applications (dApps).
Below, we’ll use on-chain analysis to consider what some of these patterns look like, a critical tool for market operators and government agencies alike.
How on-chain data could be used to identify elements of possible pump and dump schemes
Between January and December 2023, just over 370,000 tokens were launched on Ethereum, approximately 168,600 of which were available to trade on at least one decentralized exchange (DEX). As we see below, the number of monthly tokens launched has been increasing since mid-2022, with recent spikes in activity nearing 50,000 per month.
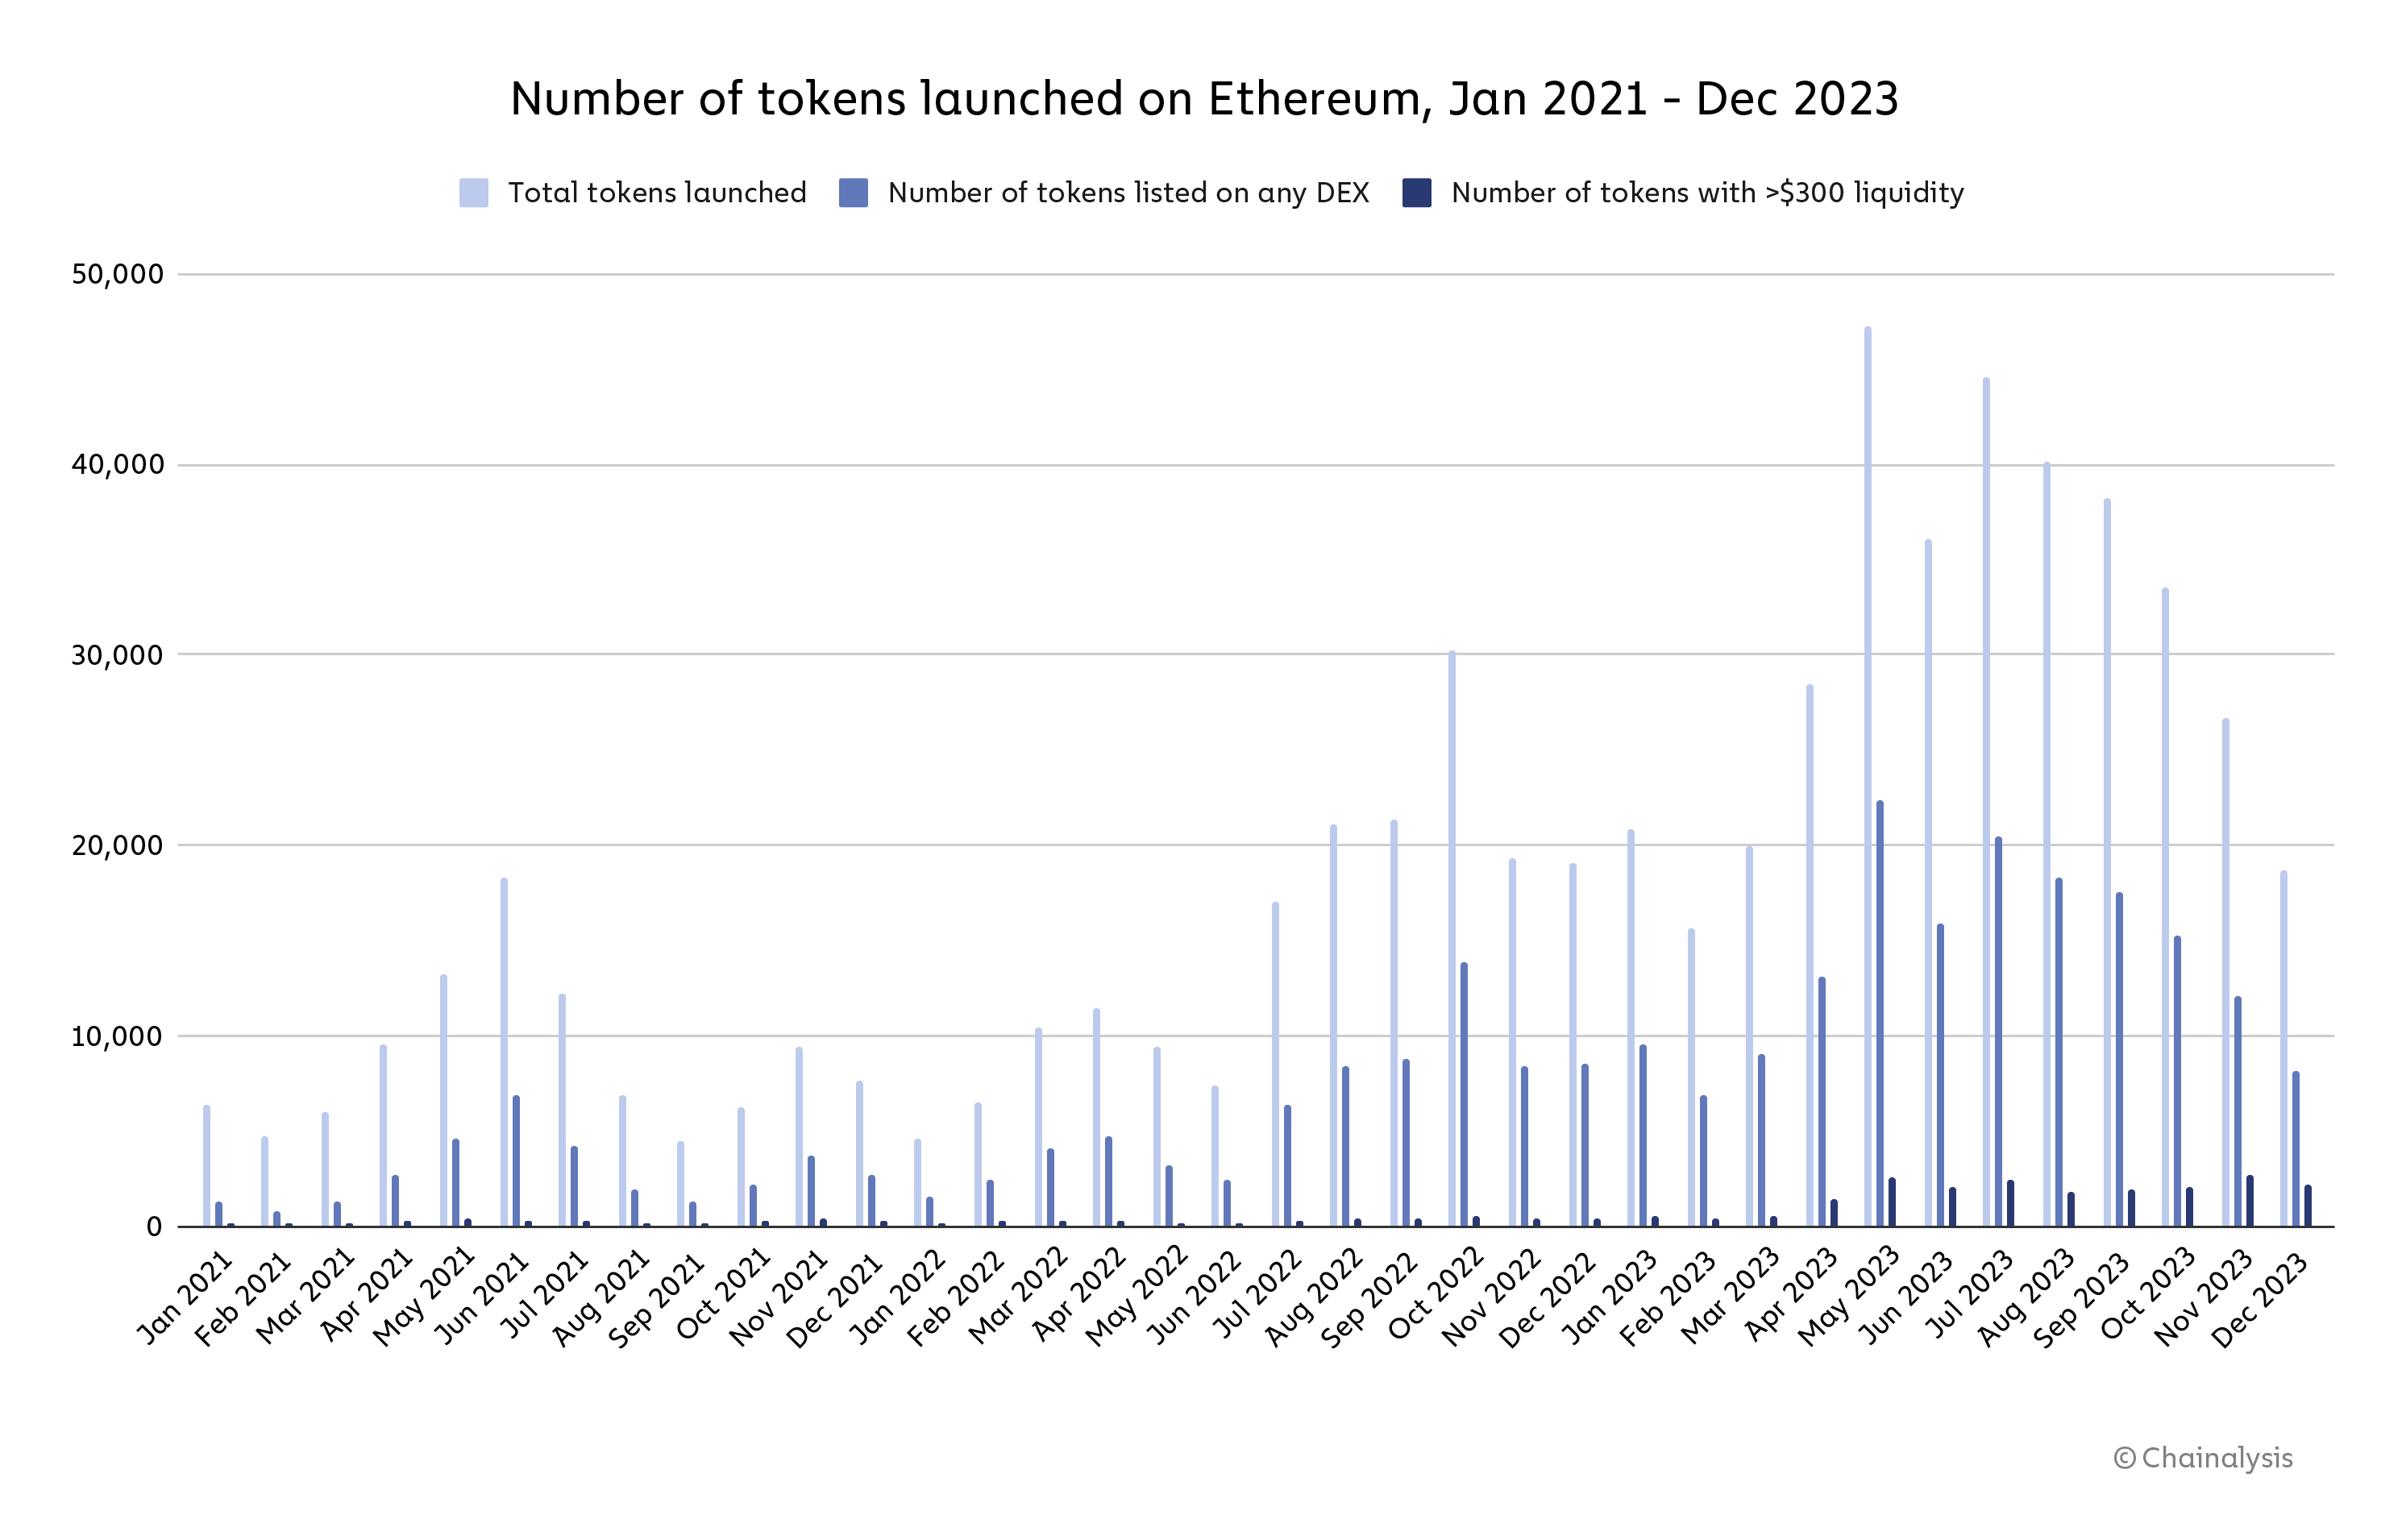
This data comes from Transpose, the comprehensive source for indexed real-time blockchain data.
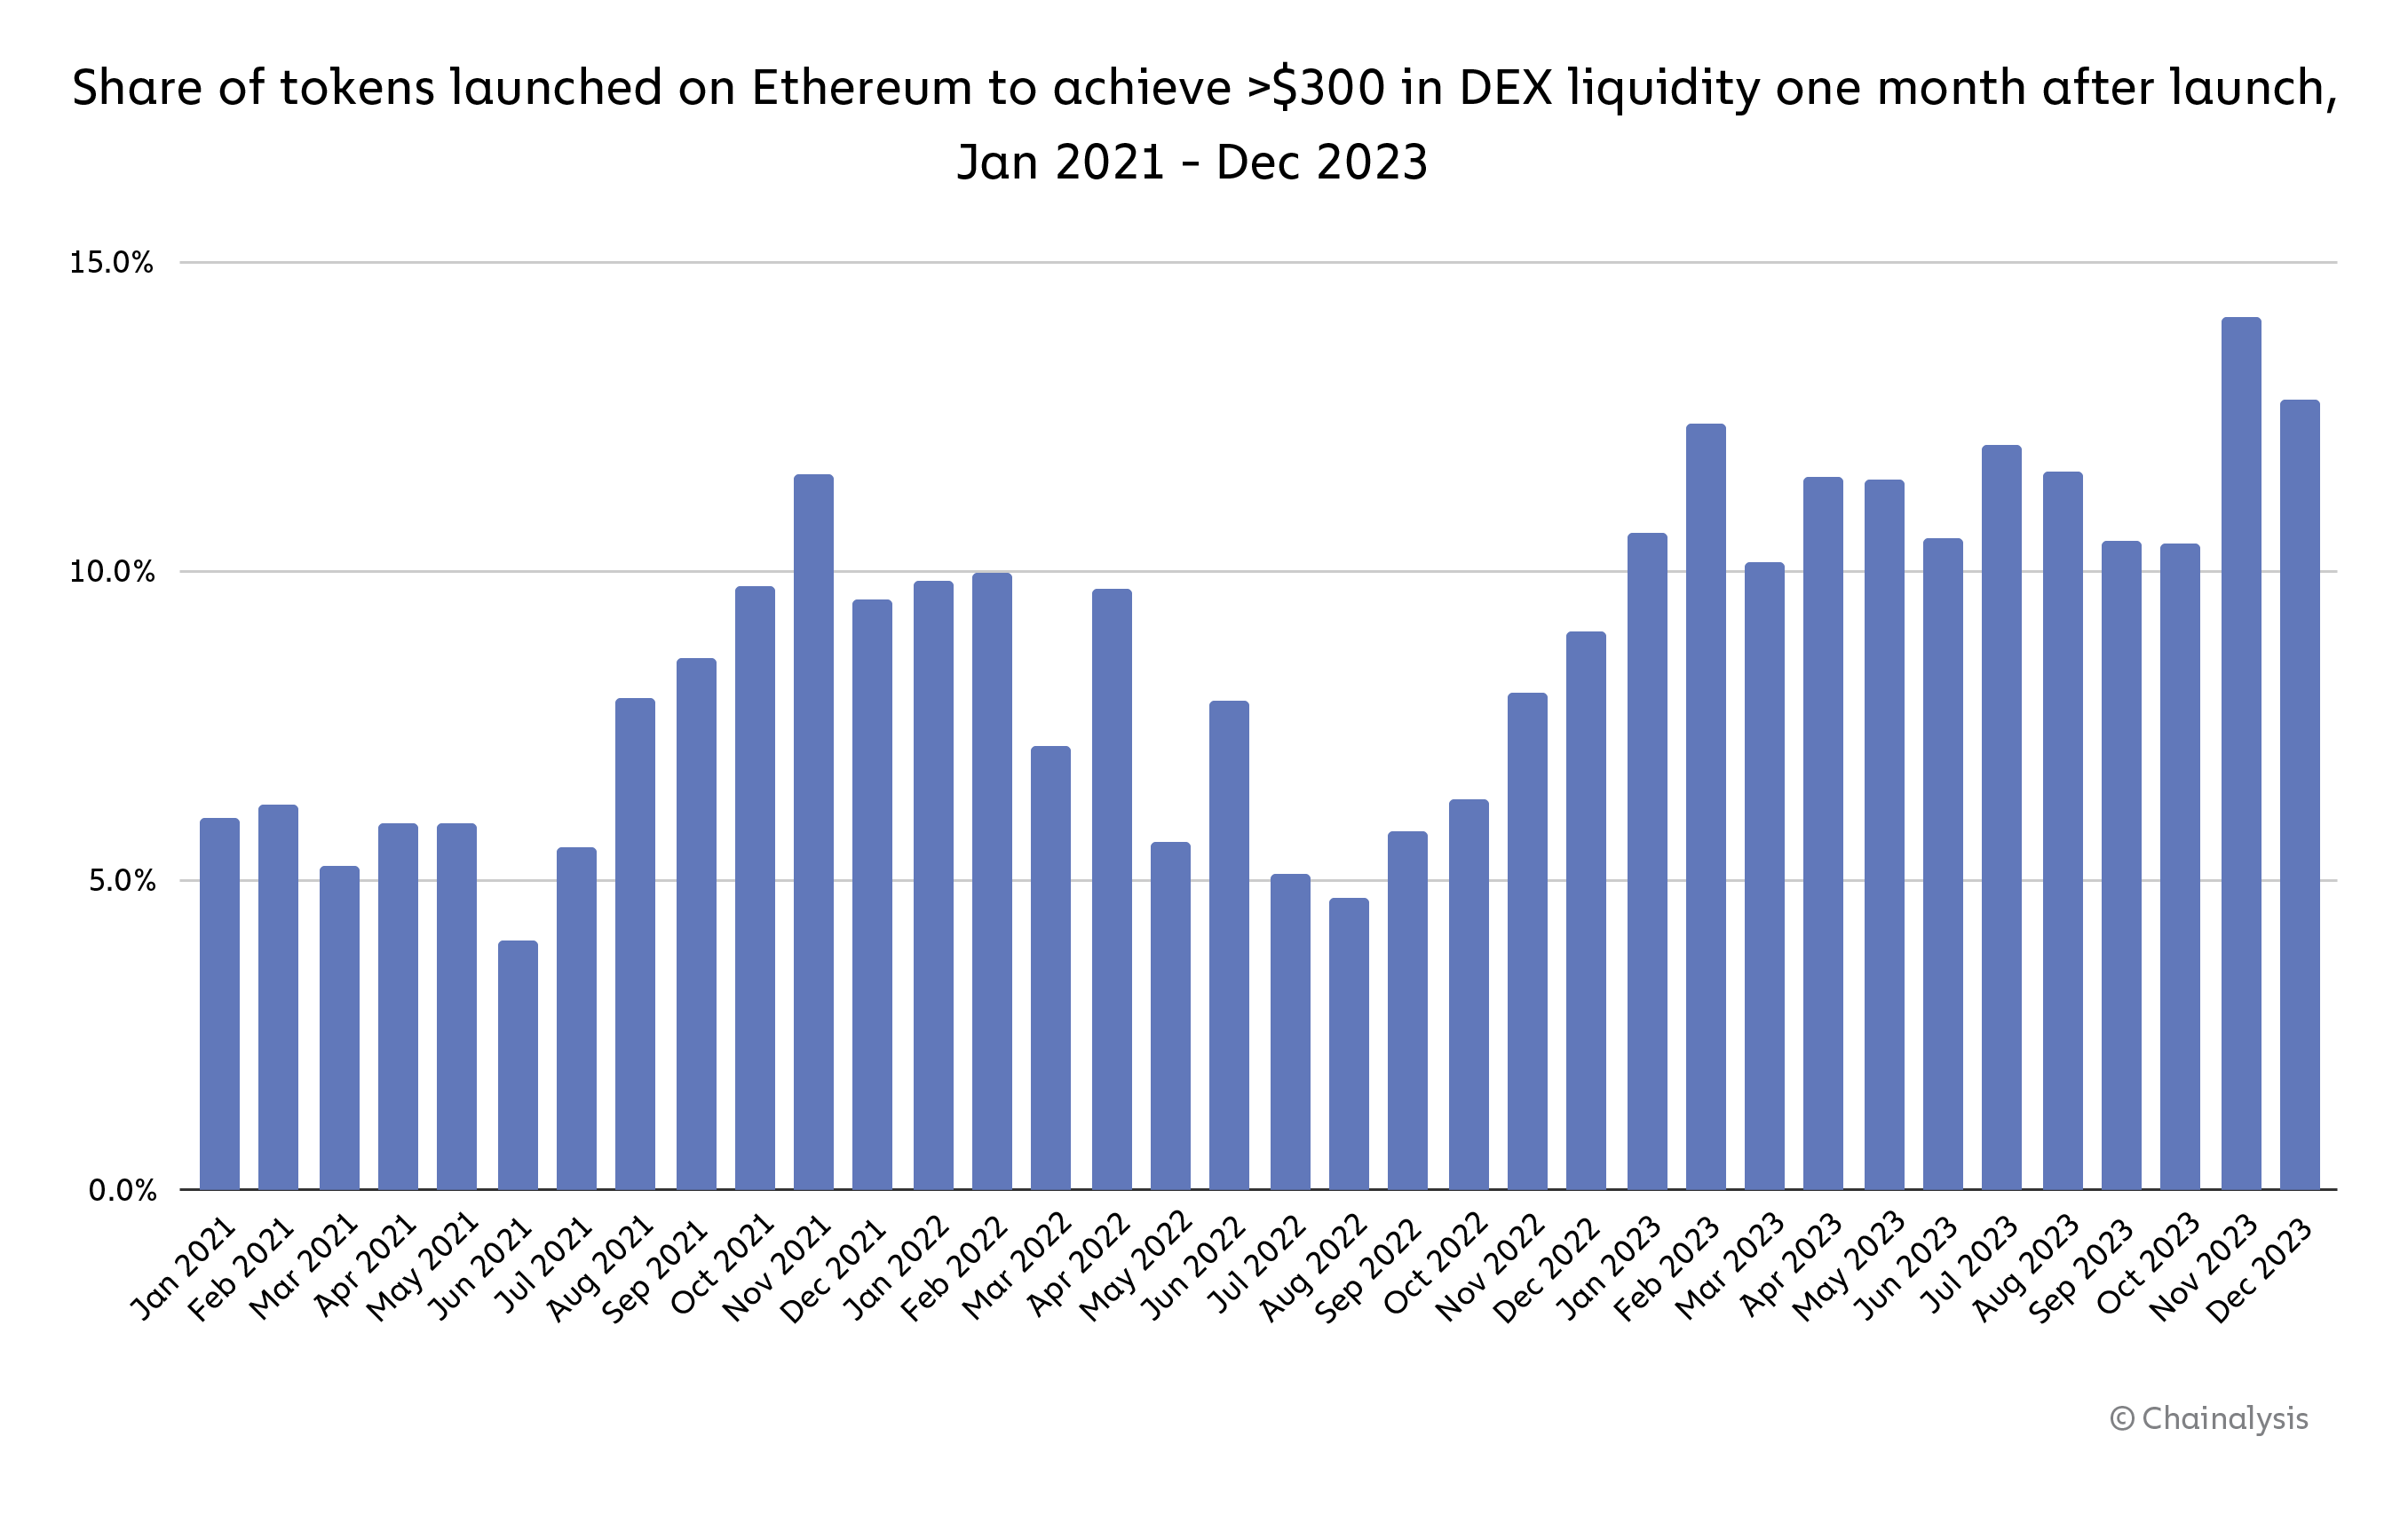
Not all of those tokens get significant traction, though. In any given month, fewer than 14.1% of all tokens launched achieve more than $300 of DEX liquidity within the subsequent month, and only 5.7% of tokens launched in 2023 are currently above that threshold. Although this is an increase from the previous two years, low liquidity values suggest that the majority of tokens launched still cannot be easily exchanged with liquid assets such as ETH, wETH, USDC, USDT, and wBTC without having their prices significantly affected.
There are many reasons that could explain the failure to reach more liquid trading volumes. As the popularity of tokenization grows, launching new tokens into an increasingly crowded marketplace becomes more challenging.
However, some may be attempts at pump and dump schemes. Here is an example of how one type of token manipulation could occur:
- An actor (or group of actors) either launches a new token or buys a large share of supply for an existing token — usually one with historically low volume.
- This actor hypes up the token as an opportunity to “get rich quick,” typically using social media and online chat rooms like Discord and Telegram.
- The persistent marketing on social media and chat rooms attracts attention from users, leading to an increase in buying.
- The actor may also engage in wash trading, which involves the simultaneous buying and selling of the same asset with the intent of falsifying its level of activity.
- If successful, the token rises in value.
- Once the token reaches the desired price target, the actor liquidates their position for a profit.
- The price of the token rapidly drops due to increased selling pressure, leaving many victims “holding the bag.”
- If the actor is also the token creator, they may completely abandon the token project, taking more users’ funds with them, also known as a “rug pull.” However, this is not always possible depending on the governance of the project.
Many of these elements can be identified in on-chain data. We utilized Transpose to look for ERC-20 tokens that met the following three criteria (“Criteria A”):
- The token was purchased five times or more by DEX users with no on-chain connection to the token’s biggest holders, indicating that it achieved some level of traction in the market.
- A single address removed more than 70.0% of the liquidity in the token’s DEX liquidity pool, indicating that the biggest holder dumped the token. In most cases, the address removed the token’s liquidity within the first few weeks of launch.
- The token currently has a liquidity of $300 or less, indicating that the market for the token essentially ceased following the removal of liquidity. If the token was involved with multiple DEX pools, we combined the liquidity.
We found that approximately 90,408 tokens met Criteria A. This number represents 24.4% of all tokens launched on Ethereum and 53.6% of tokens that were listed on a DEX during the time period studied. However, in 2023, the volume of transactions made with tokens that met Criteria A accounted for only 1.3% of total trade volume on Ethereum DEXes.
| Number of tokens | Percent of all tokens launched | |
| Total tokens launched | 370,066 | 100.0% |
| Tokens listed on DEX | 168,623 | 53.6% |
| Tokens currently with less than $300 in liquidity where a single address removed more than 70.0% of liquidity in a single transaction with five or more previous DEX purchases | 90,408 | 24.4% |
This methodology does not mean these tokens were the subjects of pump and dump schemes — rather, it illustrates how operators or regulators can leverage on-chain trading data to identify and prioritize patterns that may suggest illicit activity and warrant further investigation.
The monthly number of new tokens meeting Criteria A has been declining since mid-2023, although it is still higher than the number from 2022.
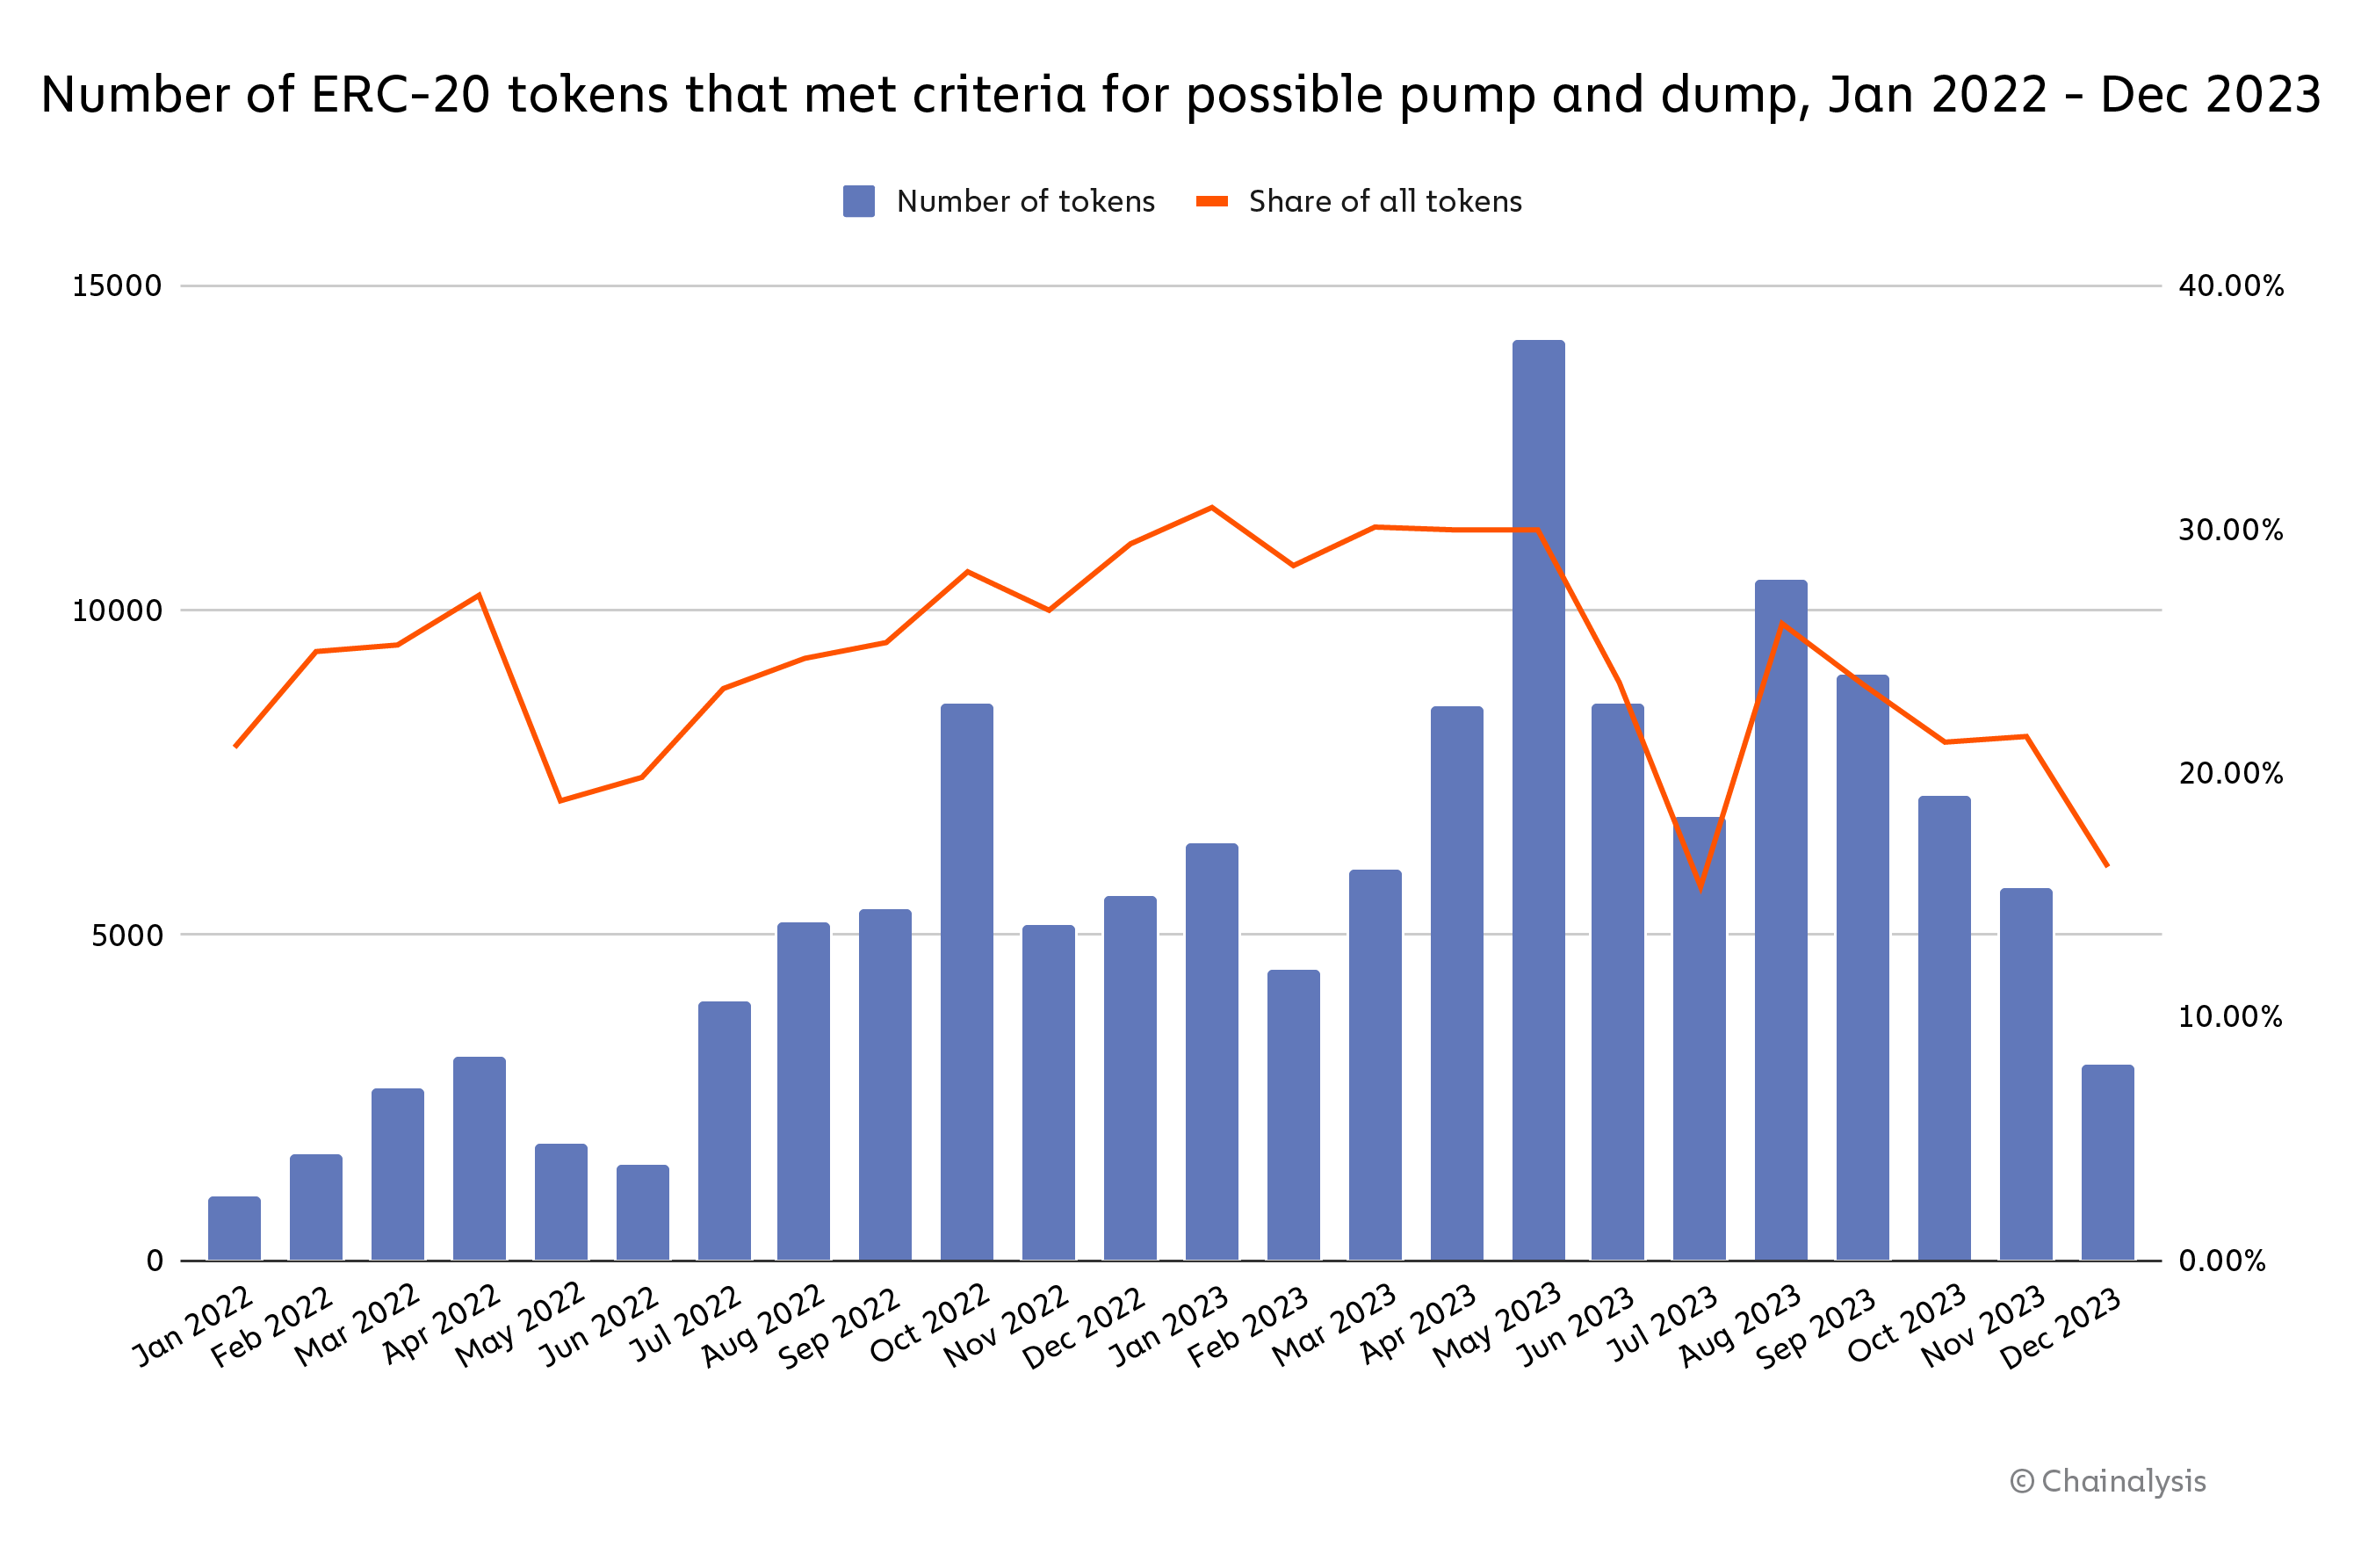
Source: Transpose
How much did actors who launched tokens meeting Criteria A profit before their tokens plummeted in value? We can calculate this using the following formula, based on how wallets associated with a token’s launch interacted with its DEX liquidity pools and traded the token itself.
A = Amount withdrawn from DEX pool by possible illicit actor
B = Amount deposited into DEX pool by possible illicit actor
C = Funds spent by illicit actor to trade token, possibly via wash trading
Profit = A – B – C
Using this formula, we calculate that actors who launched tokens meeting Criteria A collectively made approximately $241.6 million in profit in 2023, not accounting for other costs to build and launch the token.
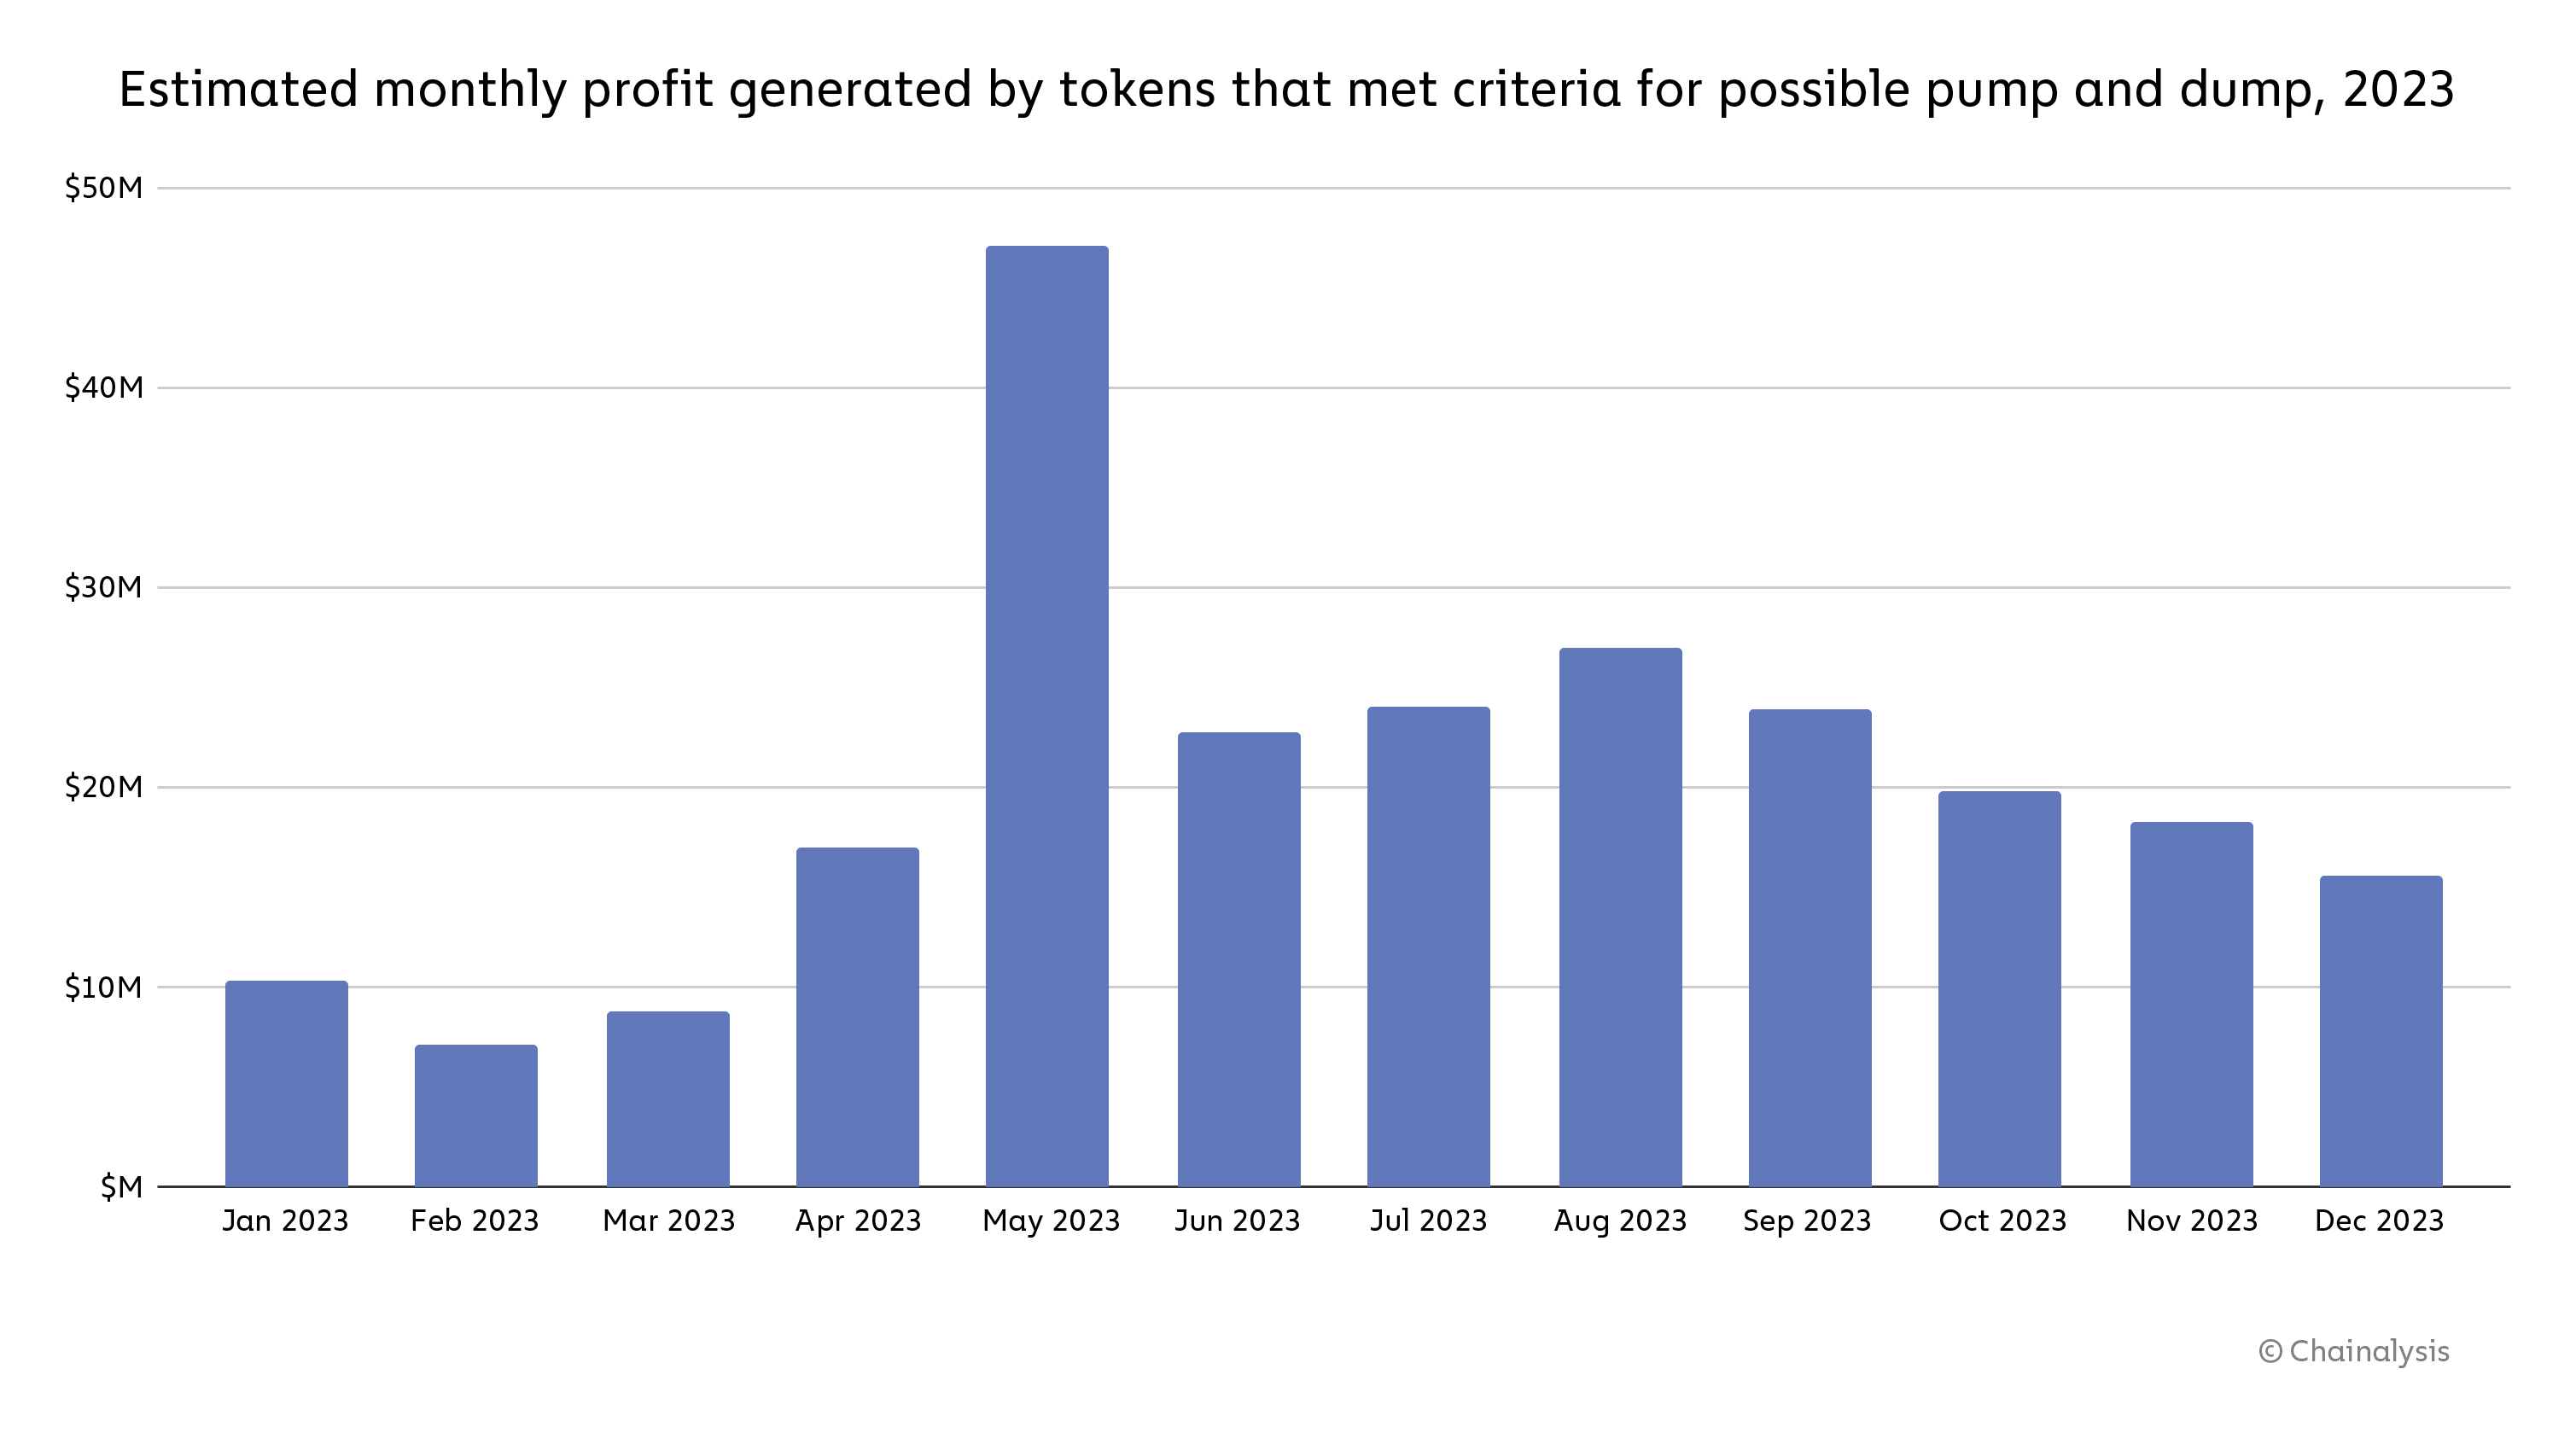
Source: Transpose
Although the total profit amassed by these actors is significant, individual tokens meeting our criteria on average produce just $2,672 each in profit and account for just 1.3% of total Ethereum DEX trading volume for 2023. The data paints a picture of an ecosystem in which potentially bad actors could generate tens of thousands of potential pump and dump tokens, most of which fail to generate significant profit and don’t attract meaningful trading volume.
Case study: One of 2023’s most prolific token creators generated 81 different tokens meeting our criteria
Some of the actors involved also appear to launch multiple tokens that meet our criteria.
During the time period studied, we identified one address — Wallet 1 on the chart below — that appears to have been involved in the most launches of tokens meeting Criteria A. The operator of this address launched 81 different token types to generate an estimated $830,000 in profits.
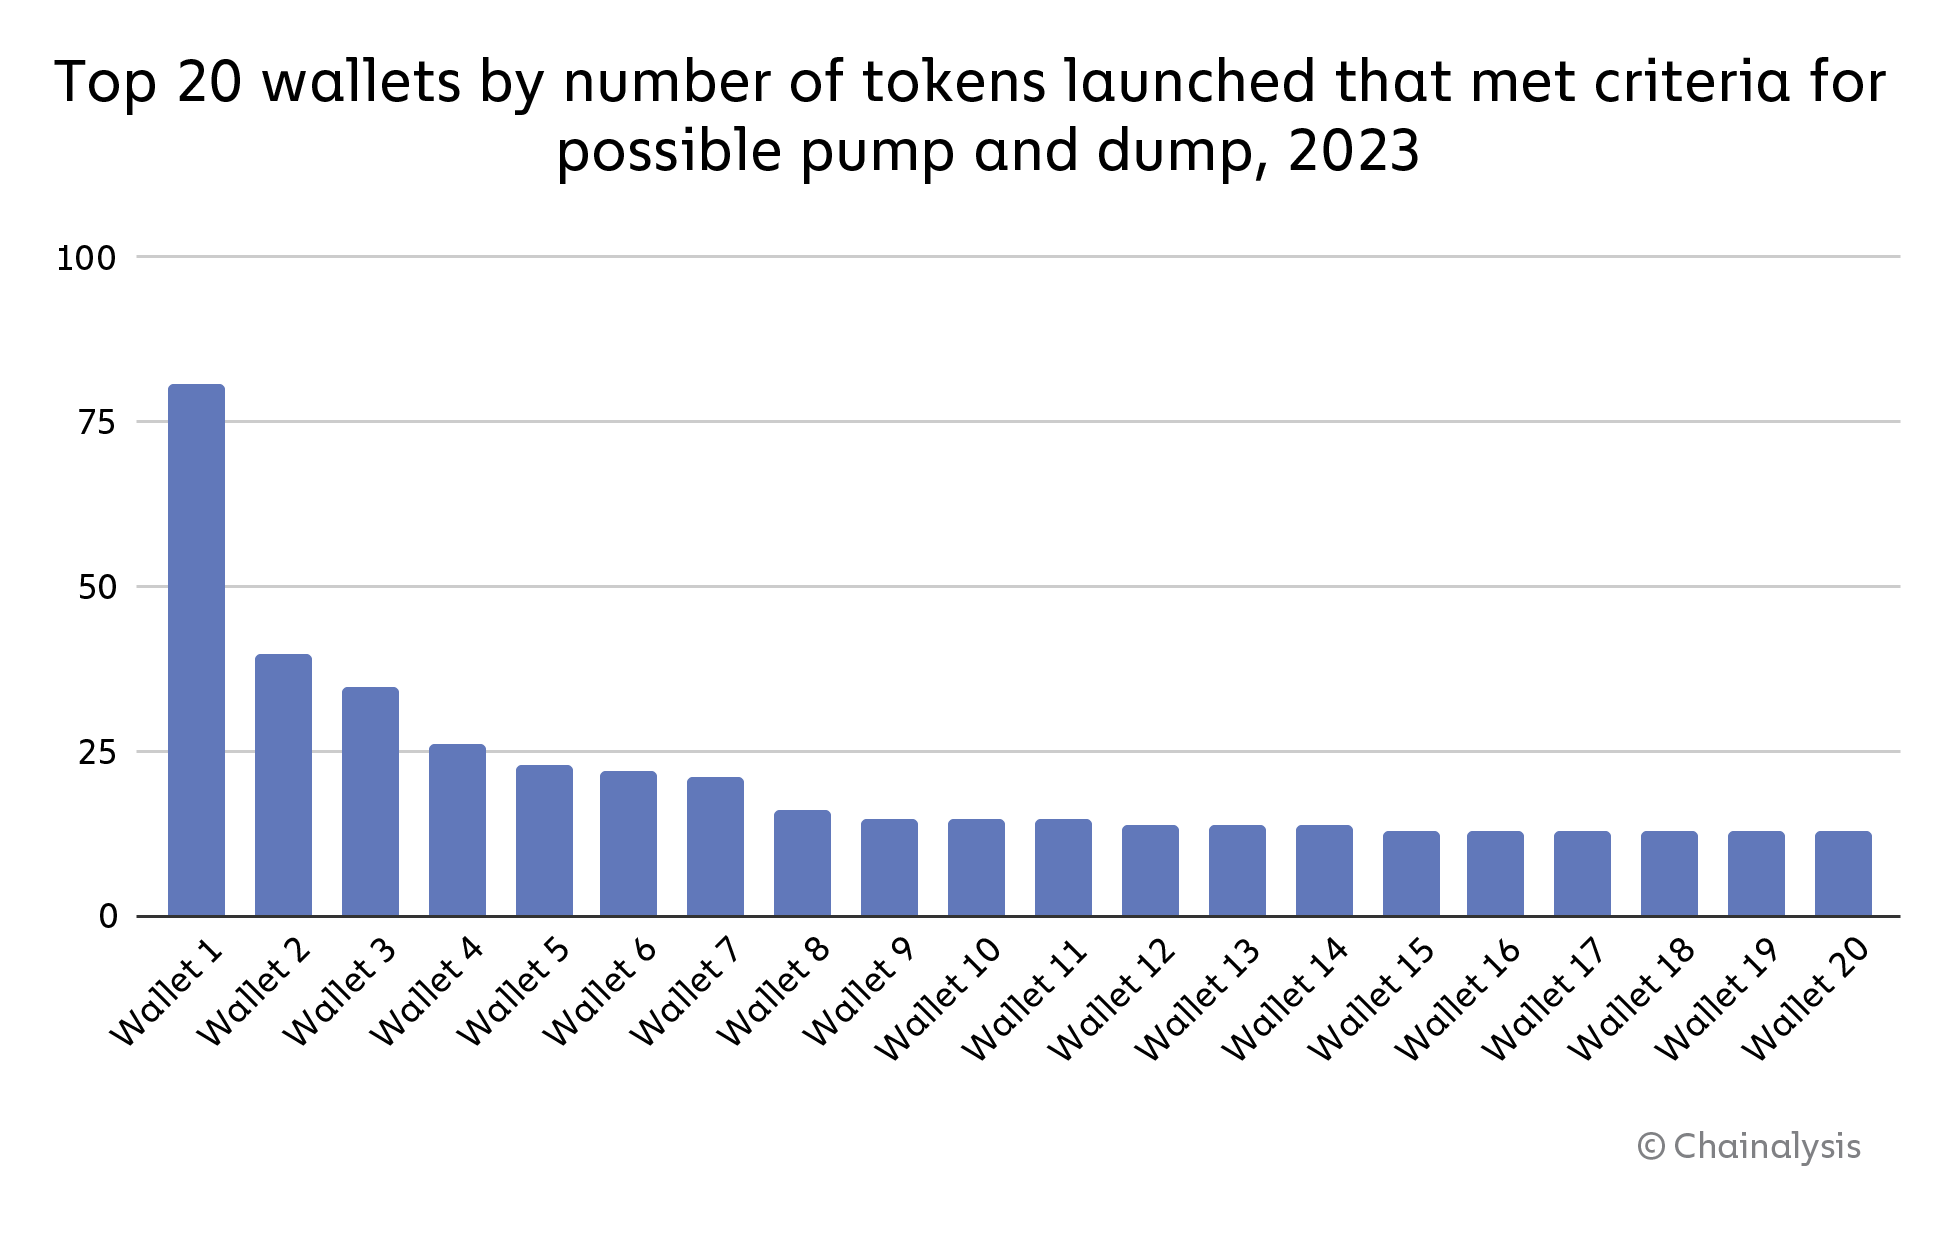
In one instance, this address earned approximately $46,000 on the launch and DEX listing of a token we’ll refer to as Token A.
We can see a breakdown of how this address operator successfully executed these activities and more using Chainalysis Storyline. First, on August 5, 2023, the address operator sent wrapped Ether (wETH) and Token A to a liquidity pool. Next, the address operator appears to have wash traded using ETH and wETH, shown by the eight subsequent transactions, and removed some liquidity on August 6, likely to take partial profits.
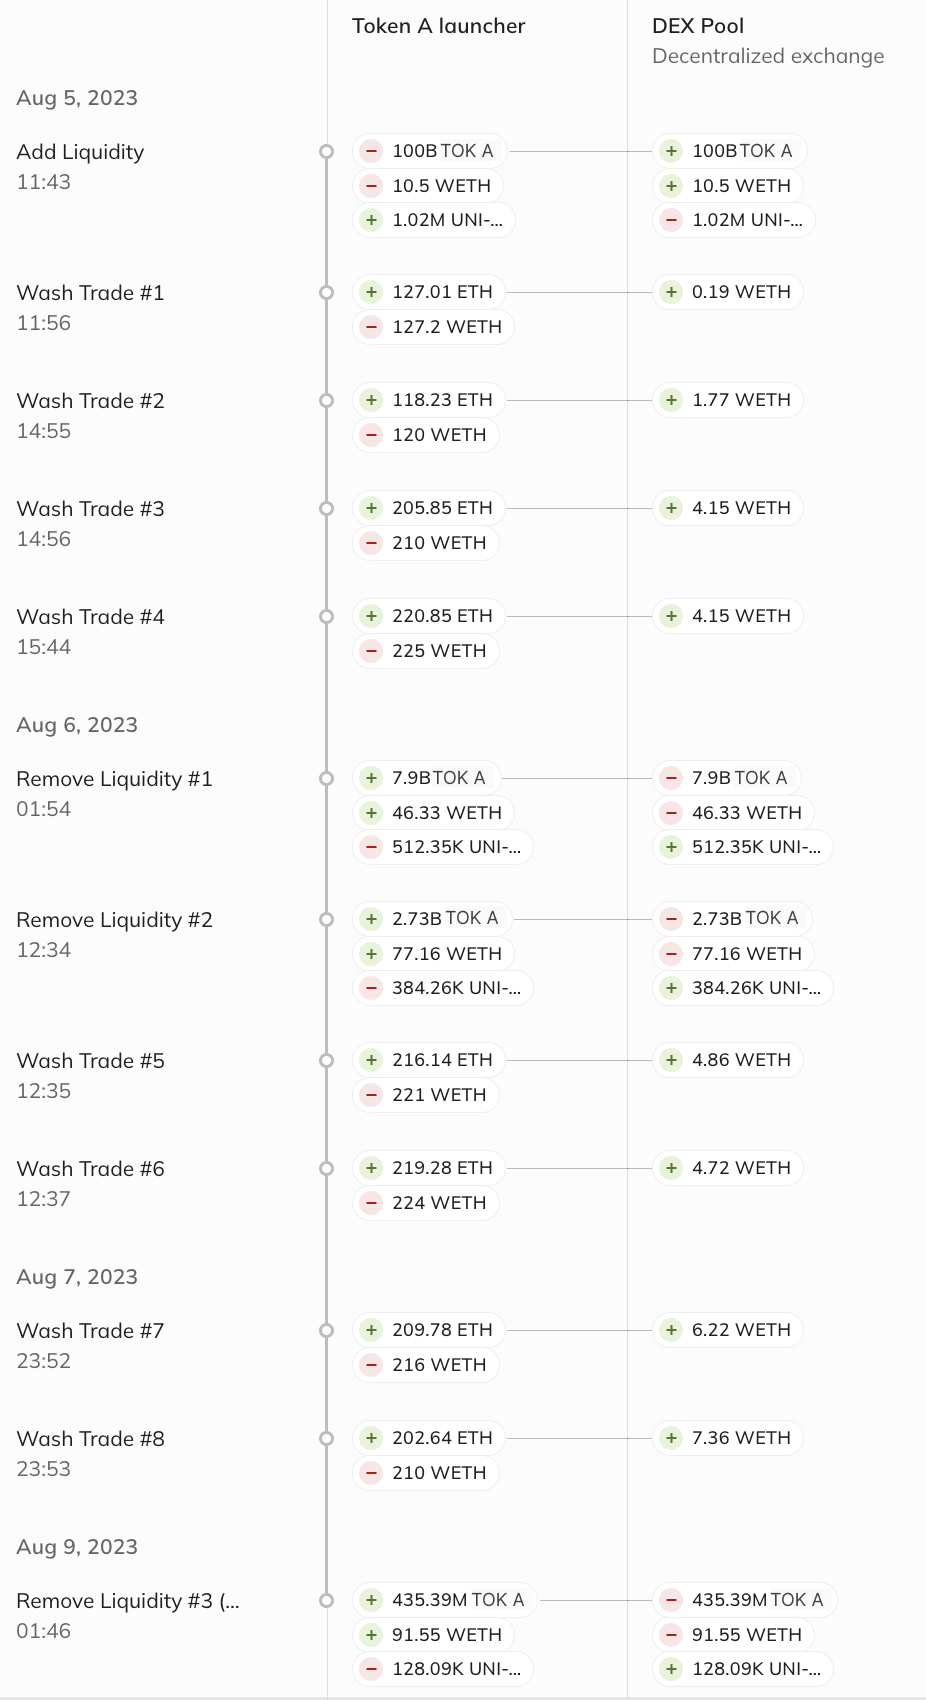
After executing these trades, the address operator removed all wETH and Token A liquidity on August 9 by selling existing positions, and left remaining users with no liquidity to sell their own assets. Since these last removals, there have been no additional transactions in this liquidity pool, suggesting a rug pull in addition to the suspected pump and dump scheme. Taken together, this activity suggests the actor may have employed different tactics for a relatively complex attack.
The below chart illustrates how the liquidity of the DEX pool shifted during this period, showing several sharp increases in the wETH balance on August 6. On the far right, we see that the liquidity moved back to zero once the address operator withdrew all funds on August 9. Overall, 108 other market participants using this DEX pool appear to have lost funds; they had purchased approximately $55,000 in Token A during this period.
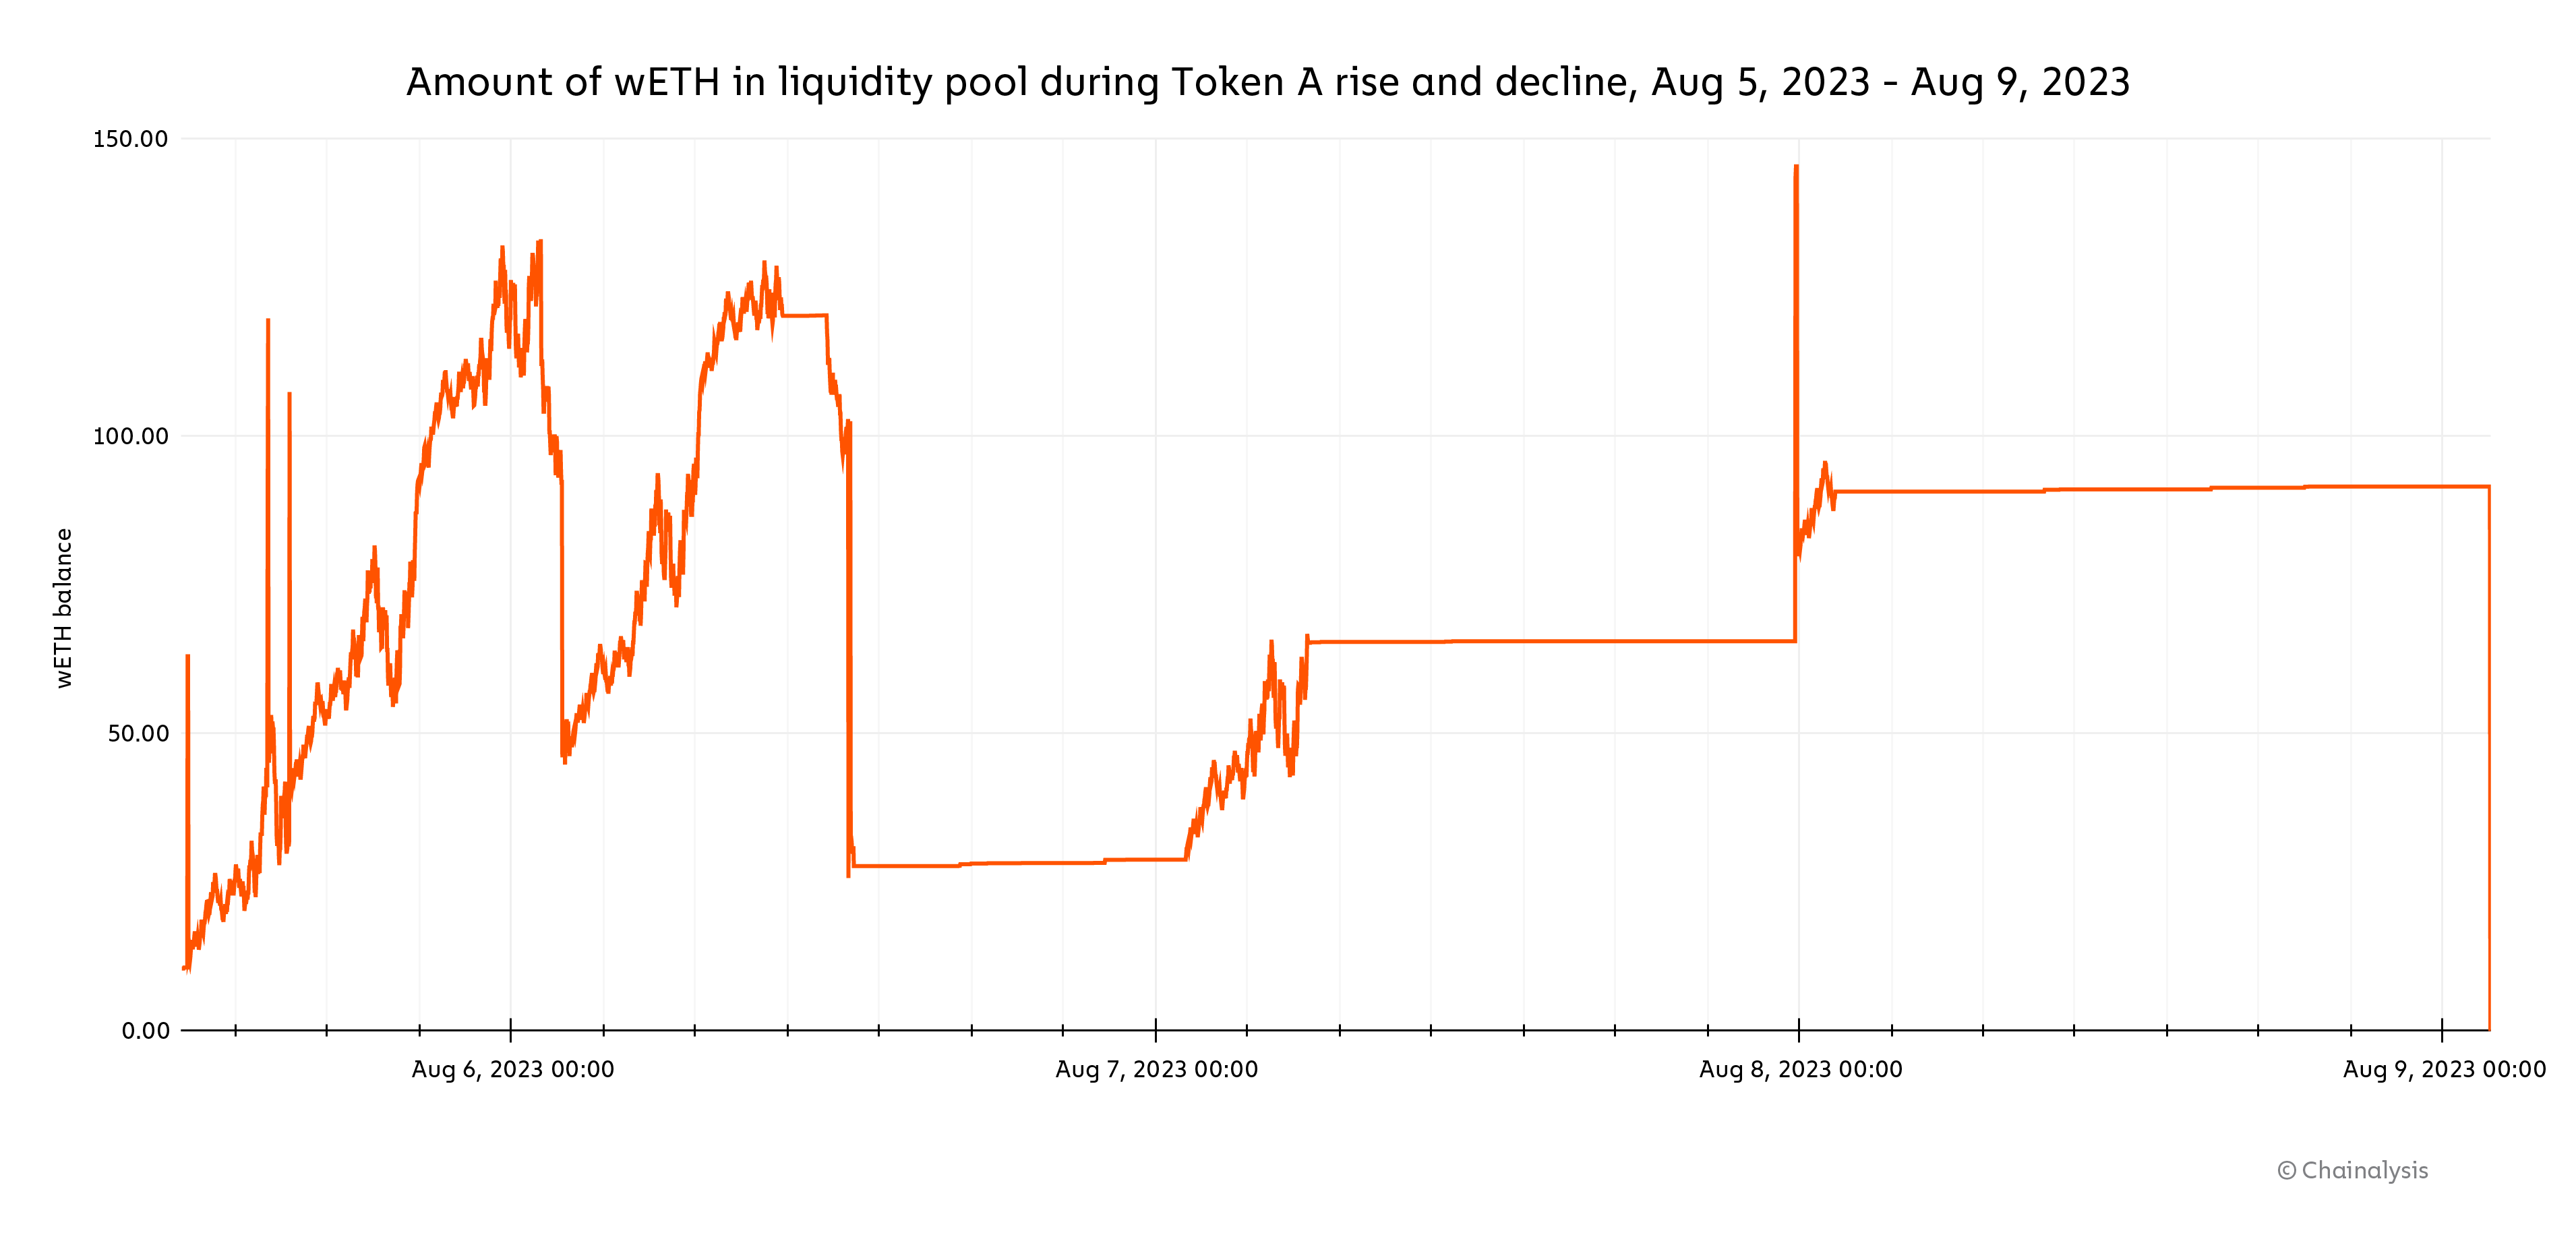
Source: Transpose
Monitoring market patterns to maintain crypto market integrity and stability
Market manipulation, such as pump and dump schemes, are destructive to the crypto markets in the same way they are to traditional markets. However, cryptocurrency’s inherent transparency provides an opportunity to build safer markets. Market operators and government agencies can deploy monitoring tools that can help identify and prioritize areas for further investigation in a way that wouldn’t be possible in traditional markets.
Tools like Transpose can help monitor on-chain data for signs of unusual activity, and help surface actionable leads in conjunction with various forms of off-chain data.
This website contains links to third-party sites that are not under the control of Chainalysis, Inc. or its affiliates (collectively “Chainalysis”). Access to such information does not imply association with, endorsement of, approval of, or recommendation by Chainalysis of the site or its operators, and Chainalysis is not responsible for the products, services, or other content hosted therein.
This material is for informational purposes only, and is not intended to provide legal, tax, financial, or investment advice. Recipients should consult their own advisors before making these types of decisions. Chainalysis has no responsibility or liability for any decision made or any other acts or omissions in connection with Recipient’s use of this material.
Chainalysis does not guarantee or warrant the accuracy, completeness, timeliness, suitability or validity of the information in this report and will not be responsible for any claim attributable to errors, omissions, or other inaccuracies of any part of such material.

